PMM’s Custom Queries in Action: Adding a Graph for InnoDB mutex waits

PMM mutex wait graph

One of the great things about Percona Monitoring and Management (PMM) is its flexibility. An example of that is how one can go beyond the exporters to collect data. One approach to achieve that is using textfile collectors, as explained in  Extended Metrics for Percona Monitoring and Management without modifying the Code. Another method, whiceeeh is the subject matter of this post, is to use custom queries.

While working on a customer’s contention issue I wanted to check the behaviour of InnoDB Mutexes over time. Naturally, I went straight to PMM and didn’t find a graph suitable for my needs. No graph, no problem! Luckily anyone can enhance PMM. So here’s how I made the graph I needed.

The final result will looks like this:
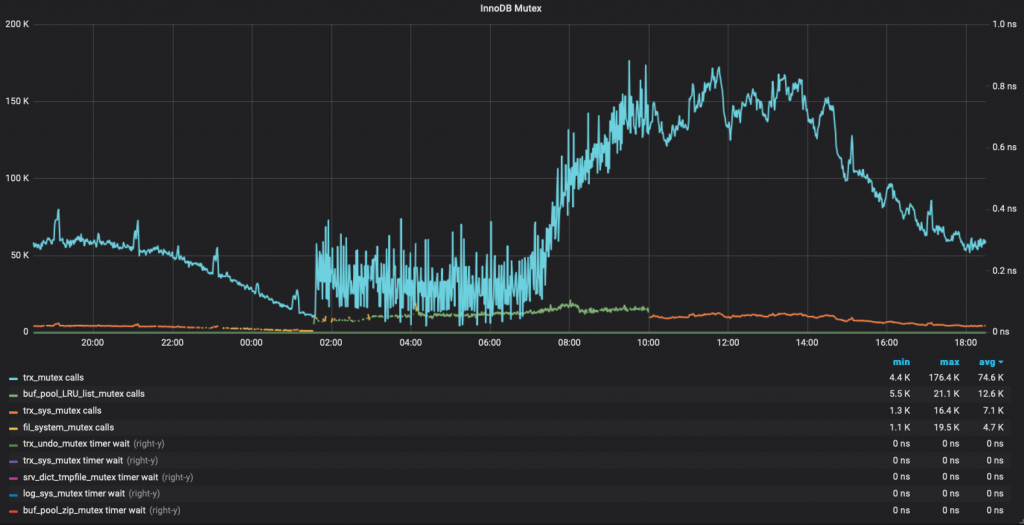
Custom Queries

What is it?

Starting from the version 1.15.0, PMM provides user the ability to take a SQL SELECT statement and turn the resultset into a metric series in PMM. That is custom queries.

How do I enable that feature?

This feature is ON by default. You only need to edit the configuration file using YAML syntax

Where is the configuration file located?

Config file location is /usr/local/percona/pmm-client/queries-mysqld.yml by default. You can change it when adding mysql metrics via pmm-admin:

pmm-admin add mysql:metrics ... -- --queries-file-name=/usr/local/percona/pmm-client/query.yml

How often is data being collected?

The queries are executed at the LOW RESOLUTION level, which by default is every 60 seconds.

InnoDB Mutex monitoring

The method used to gather Mutex status is querying the PERFORMANCE SCHEMA, as explained here: https://dev.mysql.com/doc/refman/5.7/en/monitor-innodb-mutex-waits-performance-schema.html but intentionally removed the SUM_TIMER_WAIT > 0 condition, so the query used looks like this:

SELECT
EVENT_NAME, COUNT_STAR, SUM_TIMER_WAIT
FROM performance_schema.events_waits_summary_global_by_event_name
WHERE EVENT_NAME LIKE 'wait/synch/mutex/innodb/%'

For this query to return data, some requirements need to be met:

  • The most important one: Performance Schema needs to be enabled
  • Consumers for “event_waits” enabled
  • Instruments for ‘wait/synch/mutex/innodb’ enabled.

If performance schema is enabled, the other two requirements are met by running these two queries:

update performance_schema.setup_instruments set enabled='YES' where name like 'wait/synch/mutex/innodb%';
update performance_schema.setup_consumers set enabled='YES' where name like 'events_waits%';

YAML Configuration File

This is where the magic happens. Explanation of the YAML syntax is covered in deep on the documentation: https://www.percona.com/doc/percona-monitoring-and-management/conf-mysql.html#pmm-conf-mysql-executing-custom-queries

The one used for this issue is:

---
mysql_global_status_innodb_mutex:
    query: "SELECT EVENT_NAME, COUNT_STAR, SUM_TIMER_WAIT FROM performance_schema.events_waits_summary_global_by_event_name WHERE EVENT_NAME LIKE 'wait/synch/mutex/innodb/%'"
    metrics:
      - EVENT_NAME:
          usage: "LABEL"
          description: "Name of the mutex"
      - COUNT_STAR:
          usage: "COUNTER"
          description: "Number of calls"
      - SUM_TIMER_WAIT:
          usage: "GAUGE"
          description: "Duration"

The key info is:

  • The metric name is mysql_global_status_innodb_mutex
  • Since EVENT_NAME is used as a label, it will be possible to have values per event

Remember that this should be in the queries-mysql.yml file. Full path /usr/local/percona/pmm-client/queries-mysqld.yml  inside the db node.

Once that is done, you will start to have those metrics available in Prometheus. Now, we have a graph to do!

Creating the graph in Grafana

Before jumping to grafana to add the graph, we need a proper Prometheus Query (A.K.A: PromQL). I came up with these two (one for the count_star, one for the sum_timer_wait):

topk(5, label_replace(rate(mysql_global_status_innodb_mutex_COUNT_STAR{instance="$host"}[$interval]), "mutex", "$2", "EVENT_NAME", "(.*)/(.*)" ) or label_replace(irate(mysql_global_status_innodb_mutex_COUNT_STAR{instance="$host"}[5m]), "mutex", "$2", "EVENT_NAME", "(.*)/(.*)" ))

and

topk(5, label_replace(rate(mysql_global_status_innodb_mutex_SUM_TIMER_WAIT{instance="$host"}[$interval]), "mutex", "$2", "EVENT_NAME", "(.*)/(.*)" ) or label_replace(irate(mysql_global_status_innodb_mutex_SUM_TIMER_WAIT{instance="$host"}[5m]), "mutex", "$2", "EVENT_NAME", "(.*)/(.*)" ))

These queries are basically: Return the rate values of each mutex event for a specific host. And make some regex to return only the name of the event, and discard whatever is before the last slash character.

Once we are good with our PromQL queries, we can go and add the graph.

Finally, I got the graph that I needed with a very small effort.

The dashboard is also published on the Grafana Labs Community dashboards site.

Summary

PMM’s collection of graphs and dashboard is quite complete, but it is also natural that there are specific metrics that might not be there. For those cases, you can count on the flexibility and ease usage of PMM to collect metrics and create custom graphs. So go ahead, embrace PMM, customize it, make it yours!

The JSON for this graph, so it can be imported easily, is:

{
  "aliasColors": {},
  "bars": false,
  "dashLength": 10,
  "dashes": false,
  "datasource": "Prometheus",
  "fill": 0,
  "gridPos": {
    "h": 18,
    "w": 24,
    "x": 0,
    "y": 72
  },
  "id": null,
  "legend": {
    "alignAsTable": true,
    "avg": true,
    "current": false,
    "max": true,
    "min": true,
    "rightSide": false,
    "show": true,
    "sideWidth": 0,
    "sort": "avg",
    "sortDesc": true,
    "total": false,
    "values": true
  },
  "lines": true,
  "linewidth": 2,
  "links": [],
  "nullPointMode": "null",
  "percentage": false,
  "pointradius": 0.5,
  "points": false,
  "renderer": "flot",
  "seriesOverrides": [
    {
      "alias": "/Timer Wait/i",
      "yaxis": 2
    }
  ],
  "spaceLength": 10,
  "stack": false,
  "steppedLine": false,
  "targets": [
    {
      "expr": "topk(5, label_replace(rate(mysql_global_status_innodb_mutex_COUNT_STAR{instance="$host"}[$interval]), "mutex", "$2", "EVENT_NAME", "(.*)/(.*)" )) or topk(5,label_replace(irate(mysql_global_status_innodb_mutex_COUNT_STAR{instance="$host"}[5m]), "mutex", "$2", "EVENT_NAME", "(.*)/(.*)" ))",
      "format": "time_series",
      "interval": "$interval",
      "intervalFactor": 1,
      "legendFormat": "{{ mutex }} calls",
      "refId": "A",
      "hide": false
    },
    {
      "expr": "topk(5, label_replace(rate(mysql_global_status_innodb_mutex_SUM_TIMER_WAIT{instance="$host"}[$interval]), "mutex", "$2", "EVENT_NAME", "(.*)/(.*)" )) or topk(5, label_replace(irate(mysql_global_status_innodb_mutex_SUM_TIMER_WAIT{instance="$host"}[5m]), "mutex", "$2", "EVENT_NAME", "(.*)/(.*)" ))",
      "format": "time_series",
      "interval": "$interval",
      "intervalFactor": 1,
      "legendFormat": "{{ mutex }} timer wait",
      "refId": "B",
      "hide": false
    }
  ],
  "thresholds": [],
  "timeFrom": null,
  "timeShift": null,
  "title": "InnoDB Mutex",
  "tooltip": {
    "shared": true,
    "sort": 2,
    "value_type": "individual"
  },
  "transparent": false,
  "type": "graph",
  "xaxis": {
    "buckets": null,
    "mode": "time",
    "name": null,
    "show": true,
    "values": []
  },
  "yaxes": [
    {
      "format": "short",
      "label": "",
      "logBase": 1,
      "max": null,
      "min": null,
      "show": true
    },
    {
      "decimals": null,
      "format": "ns",
      "label": "",
      "logBase": 1,
      "max": null,
      "min": "0",
      "show": true
    }
  ],
  "yaxis": {
    "align": false,
    "alignLevel": null
  }
}

Percona Monitoring and Management (PMM) 1.17.1 Is Now Available

Percona Monitoring and Management 1.17.0

Percona Monitoring and Management

Percona Monitoring and Management (PMM) is a free and open-source platform for managing and monitoring MySQL®, MongoDB®, and PostgreSQL performance. You can run PMM in your own environment for maximum security and reliability. It provides thorough time-based analysis for MySQL®, MongoDB®, and PostgreSQL® servers to ensure that your data works as efficiently as possible.

In this release, we are introducing support for detection of our upcoming PMM 2.0 release in order to avoid potential version conflicts in the future, as PMM 1.x will not be compatible with PMM 2.x.

Another improvement in this release is we have updated the Tooltips for Dashboard MySQL Query Response Time by providing a description of what the graphs display, along with links to related documentation resources. An example of Tooltips in action:

PMM 1.17.1 release provides fixes for CVE-2018-16492 and CVE-2018-16487 vulnerabilities, related to Node.js modules. The authentication system used in PMM is not susceptible to the attacks described in these CVE reports. PMM does not use client-side data objects to control user-access.

In release 1.17.1 we have included two improvements and fixed nine bugs.

Improvements

  • PMM-1339: Improve tooltips for MySQL Query Response Time dashboard
  • PMM-3477: Add Ubuntu 18.10 support

Fixed Bugs

  • PMM-3471: Fix global status metric names in mysqld_exporter for MySQL 8.0 compatibility
  • PMM-3400: Duplicate column in the Query Analytics dashboard Explain section
  • PMM-3353: postgres_exporter does not work with PostgreSQL 11
  • PMM-3188: Duplicate data on Amazon RDS / Aurora MySQL Metrics dashboard
  • PMM-2615: Fix wrong formatting in log which appears if pmm-qan-agent process fails to start
  • PMM-2592: MySQL Replication Dashboard shows error with multi-source replication
  • PMM-2327: Member State Uptime and Max Member Ping time charts on the MongoDB ReplSet dashboard return an error
  • PMM-955: Fix format of User Time and CPU Time Graphs on MySQL User Statistics dashboard
  • PMM-3522: CVE-2018-16492 and CVE-2018-16487

Help us improve our software quality by reporting any Percona Monitoring and Management bugs you encounter using our bug tracking system.

Reducing High CPU on MySQL: a Case Study

CPU Usage after query tuning

In this blog post, I want to share a case we worked on a few days ago. I’ll show you how we approached the resolution of a MySQL performance issue and used Percona Monitoring and Management PMM to support troubleshooting. The customer had noticed a linear high CPU usage in one of their MySQL instances and was not able to figure out why as there was no much traffic hitting the app. We needed to reduce the high CPU usage on MySQL. The server is a small instance:

Models | 6xIntel(R) Xeon(R) CPU E5-2430 0 @ 2.20GHz
10GB RAM

This symptom can be caused by various different reasons. Let’s see how PMM can be used to troubleshoot the issue.

CPU

The original issue - CPU usage at almost 100% during application use

It’s important to understand where the CPU time is being consumed: user space, system space, iowait, and so on. Here we can see that CPU usage was hitting almost 100% and the majority of the time was being spent on user space. In other words, the time the CPU was executing user code, such as MySQL. Once we determined that the time was being spent on user space, we could discard other possible issues. For example, we could eliminate the possibility that a high amount of threads were competing for CPU resources, since that would cause an increase in context switches, which in turn would be taken care of by the kernel – system space.

With that we decided to look into MySQL metrics.

MySQL

Thread activity graph in PMM for MySQL

Queries per second

As expected, there weren’t a lot of threads running—10 on average—and MySQL wasn’t being hammered with questions/transactions. It was running from 500 to 800 QPS (queries per second). Next step was to check the type of workload that was running on the instance:

All the commands are of a SELECT type, in red in this graph

In red we can see that almost all commands are SELECTS. With that in mind, we checked the handlers using 

SHOW STATUS LIKE 'Handler%'

 to verify if those selects were doing an index scan, a full table scan or what.

Showing that the query was a full table scan

Blue in this graph represents

Handler_read_rnd_next

 , which is the counter MySQL increments every time it reads a row when it’s doing a full table scan. Bingo!!! Around 350 selects were reading 2.5 million rows. But wait—why was this causing CPU issues rather than IO issues? If you refer to the first graph (CPU graph) we cannot see iowait.

That is because the data was stored in the InnoDB Buffer Pool, so instead of having to read those 2.5M rows per second from disk, it was fetching them from memory. The stress had moved from disk to CPU. Now that we identified that the issue had been caused by some queries or query, we went to QAN to verify the queries and check their status:

identifying the long running query in QAN

First query, a

SELECT

  on table 

store.clients

 was responsible for 98% of the load and was executing in 20+ seconds.

The initial query load

EXPLAIN confirmed our suspicions. The query was accessing the table using type ALL, which is the last type we want as it means “Full Table Scan”. Taking a look into the fingerprint of the query, we identified that it was a simple query:

Fingerprint of query
Indexes on table did not include a key column

The query was filtering clients based on the status field

SELECT * FROM store.clients WHERE status = ?

 As shown in the indexes, that column was not indexed. Talking with the customer, this turned out to be a query that was introduced as part of a new software release.

From that point, we were confident that we had identified the problem. There could be more, but this particular query was definitely hurting the performance of the server. We decided to add an index and also sent an annotation to PMM, so we could refer back to the graphs to check when the index has been added, check if CPU usage had dropped, and also check Handler_read_rnd_next.

To run the alter we decided to use pt-online-schema-change as it was a busy table, and the tool has safeguards to prevent the situation from becoming even worse. For example, we wanted to avoid pausing or even aborting the alter in the case of the number of Threads_Running exceeding a certain threshold. The threshold is controlled by

--max-load

  (25 by default) and

--critical-load

  (50 by default):

pmm-admin annotate "Started ALTER store.clients ADD KEY (status)" && 
pt-online-schema-change --alter "ADD KEY (status)" --execute u=root,D=store,t=clients && 
pmm-admin annotate "Finished ALTER store.clients ADD KEY (status)"
Your annotation was successfully posted.
No slaves found. See --recursion-method if host localhost.localdomain has slaves.
Not checking slave lag because no slaves were found and --check-slave-lag was not specified.
Operation, tries, wait:
analyze_table, 10, 1
copy_rows, 10, 0.25
create_triggers, 10, 1
drop_triggers, 10, 1
swap_tables, 10, 1
update_foreign_keys, 10, 1
Altering `store`.`clients`...
Creating new table...
Created new table store._clients_new OK.
Altering new table...
Altered `store`.`_clients_new` OK.
2019-02-22T18:26:25 Creating triggers...
2019-02-22T18:27:14 Created triggers OK.
2019-02-22T18:27:14 Copying approximately 4924071 rows...
Copying `store`.`clients`: 7% 05:46 remain
Copying `store`.`clients`: 14% 05:47 remain
Copying `store`.`clients`: 22% 05:07 remain
Copying `store`.`clients`: 30% 04:29 remain
Copying `store`.`clients`: 38% 03:59 remain
Copying `store`.`clients`: 45% 03:33 remain
Copying `store`.`clients`: 52% 03:06 remain
Copying `store`.`clients`: 59% 02:44 remain
Copying `store`.`clients`: 66% 02:17 remain
Copying `store`.`clients`: 73% 01:50 remain
Copying `store`.`clients`: 79% 01:23 remain
Copying `store`.`clients`: 87% 00:53 remain
Copying `store`.`clients`: 94% 00:24 remain
2019-02-22T18:34:15 Copied rows OK.
2019-02-22T18:34:15 Analyzing new table...
2019-02-22T18:34:15 Swapping tables...
2019-02-22T18:34:27 Swapped original and new tables OK.
2019-02-22T18:34:27 Dropping old table...
2019-02-22T18:34:32 Dropped old table `store`.`_clients_old` OK.
2019-02-22T18:34:32 Dropping triggers...
2019-02-22T18:34:32 Dropped triggers OK.
Successfully altered `store`.`clients`.
Your annotation was successfully posted.

Results

MySQL Handlers after query tuning MySQL query throughput after query tuning
Query analysis by EXPLAIN in PMM after tuning

As we can see, above, CPU usage dropped to less than 25%, which is 1/4 of the previous usage level. Handler_read_rnd_next dropped and we can’t even see it once pt-osc has finished. We had a small increase on Handler_read_next as expected because now MySQL is using the index to resolve the WHERE clause. One interesting outcome is that the instance was able to increase it’s QPS by 2x after the index was added as CPU/Full Table Scan was no longer limiting performance. On average, query time has dropped from 20s to only 661ms.

Summary:

  1. Applying the correct troubleshooting steps to your problems is crucial:
    a) Understand what resources have been saturated.
    b) Understand what if anything is causing an error.
    c) From there you can divert into the areas that are related to that resource and start to narrow down the issue.
    d) Tackle the problems bit by bit.
  2. Having the right tools for the job key for success. PMM is a great example of a tool that can help you quickly identify, drill in, and fix bottlenecks.
  3. Have realistic load tests. In this case, they had tested the new release on a concurrency level that was not like their production
  4. By identifying the culprit query we were able to:
    a.) Drop average query time from 20s to 661ms
    b.) Increase QPS by 2x
    c.) Reduce the usage of CPU to 1/4 of its level prior to our intervention

Disclosure: For security reasons, sensitive information, such as database, table, column names have been modified and graphs recreated to simulate a similar problem.

Does Percona Monitoring and Management (PMM) Support External Monitoring Services? Yes It Does!

External Monitoring Services

Percona Monitoring and Management (PMM) is a free and open-source platform for managing and monitoring MySQL and MongoDB performance. You can run PMM in your own environment for maximum security and reliability. It provides thorough time-based analysis for MySQL and MongoDB servers to ensure that your data works as efficiently as possible.

Starting with version 1.4.0 and improved in 1.7.0, PMM supports external monitoring services. This means you can plug in Prometheus exporters for technologies not directly provided by Percona. For example, you can start monitoring the metrics of your PostgreSQL database host, Memcached or Redis.

Exporters Overview

Applications store their metrics in arbitrary formats, and Prometheus exporters collect them and produce (or export to) a consistent format of key-value pairs. The keys refer to metric types and values are numbers in the float 64 format. Due to the diversity of formats that applications may use, you should program a specific exporter for each format. However, if you decide to make the metrics of your application available via PMM you may consider using one of existing Prometheus exporters.

Currently, PMM offers exporters for MySQL (mysqld_exporter) and MongoDB (mongodb_exporter) database management systems. Built-in exporters also exist for Percona XtraDBCluster, MariaDB, RDS and Aurora via mysqld_exporter and for ProxySQL (via proxysql_exporter). These exporters are made available as monitoring services that you can add or remove as necessary. In addition, PMM includes the node_exporter to capture the host level Linux metrics such as CPU, Load, and disk resources.

Using Exporters

On the computer where the PMM client is installed and connected to a PMM server, make use of the pmm-admin utility to add any built-in monitoring service directly. There is no extra effort in this case: the added monitoring service will run its exporter and all required configuration updates are made automatically to make the metrics available in the web interface for further analysis in Query analytics and Metrics monitor.

In case of external monitoring services, you need to locate, download, set up and run the specific Prometheus exporter to collect metrics. When it is ready, you can add it as a monitoring service:

pmm-admin add external:service job_name [instance] --service-port=PORT_NUMBER

This command adds an external monitoring service bound to the Prometheus job that you specify as the job_name parameter. You should also provide the port associated with this Prometheus job as the value of the service-port parameter. The instance parameter is optional. By default, it is assigned the name of the host where you run pmm-admin.

Example 1: Adding a PostgreSQL Monitoring Service

In order to add an external monitoring service for a PostgreSQL database server, make sure to install and configure your PostgreSQL server. Then, select a PostgreSQL Prometheus exporter from the list available from the  Prometheus site, such as PostgreSQL metric exporter for Prometheus. Refer to the documentation for this exporter for details about how to install and set it up.

As soon as your Prometheus exporter can collect metrics from your PostgreSQL database server,  you are ready to add this exporter as a monitoring service. Make sure that you have access to a configured PMM server and your PMM client has been set up to use it. Use the pmm-admin utility, which is part of PMM client, to add the PostgreSQL monitoring service. Assuming postgresql is the name of this monitoring service, your command should look like this:

pmm-admin add external:service --service-port=PORT_NUMBER postgresql

It is time now to display the metrics on the PMM Server. Open Metrics Monitor and check the Advanced Data Exploration dashboard. This can dashboard visualize a lot of metrics including those exposed by external monitoring services. In the Host field select your host. Use the Metric field to select a metric.

External Monitoring Services
Viewing a metric exposed by a PostgreSQL exporter.

Setting up an external monitoring service requires extra work compared to adding built-in monitoring services. However, by using external monitoring services you can considerably extend the capabilities of your PMM installation.

Note that running the pmm-admin list command lists the added external monitoring services. They also appear in the JSON output, too. To remove an external service use the remove (or its short form rm) command:

pmm-admin rm external:service --service-port=PORT_NUMBER NAME_OF_EXTERNAL_MONITORING_SERVICE

$ sudo pmm-admin list
pmm-admin 1.7.0
PMM Server      | 192.0.2.2 (password-protected)
Client Name     | postgres01
Client Address  | 192.0.2.3
Service Manager | unix-systemv
Job name    Scrape interval  Scrape timeout  Metrics path  Scheme  Target         Labels                   Health
postgresql  1s               1s              /metrics      http    192.0.2.3:9187 instance="postgres01"      UP

Example 2: Adding a Redis Monitoring Service

To start with, you must install a Prometheus exporter for Redis (this exporter is listed on the Prometheus Exporters and Integrations page) on the machine where your PMM client runs. The following command adds this exporter as an external monitoring service (run it as a superuser or use sudo). This time the command has an extra parameter:

$ sudo pmm-admin add external:service redis --service-port 9121 redis01
External service added.

Notice that we use Redis Server as the last parameter passed to pmm-admin add external:service command. The last positional parameter is a label that you assign to this particular instance.

pmm-admin add external:service --service-port=PORT_NUMBER NAME_OF_EXTERNAL_MONITORING_SERVICE [INSTANCE_LABEL]

You may choose any name for this purpose. Make sure to use quotes if you decide to use a label made of two or more words.

$ sudo pmm-admin list
pmm-admin 1.7.0
PMM Server | 127.0.0.1
Client Name | percona
Client Address | 172.17.0.1
Service Manager | linux-systemd
No services under monitoring.
Job name Scrape interval Scrape timeout Metrics path Scheme Target          Labels                  Health
redis    1m0s            10s            /metrics     http   172.17.0.1:9121 instance="redis01"      UP

To view Redis related metrics you need to open the Advanced Data Exploration dashboard on your PMM Server. The redis01 label automatically appears in the Host field in the Advanced Data Exploration dashboard. In the Host field, select the redis01 option and choose a metric to view from the Metric field, such as redis_exporter_scrapes_total.

Other Ways to Add External Services

The pmm-admin add external:service command is the recommended way to add an external monitoring service. There exist other, more specific, methods. The pmm-admin add external:metrics adds external Prometheus exporters job to metrics monitoring.

Amazon Aurora MySQL Monitoring with Percona Monitoring and Management (PMM)

Amazon Aurora MySQL Monitoring small

In this blog post, we’ll review additional Amazon Aurora MySQL monitoring capabilities we’ve added in Percona Monitoring and Management (PMM) 1.7.0. You can see them in action in the MySQL Amazon Aurora Metrics dashboard.

Amazon Aurora MySQL Transaction CommitsAmazon Aurora MySQL Monitoring

This graph looks at the number of commits the Amazon Aurora engine performed, as well as the average commit latency. As you can see from this graph, latency does not always correlate with the number of commits performed and can be quite high in certain situations.

Amazon Aurora MySQL LoadAmazon Aurora MySQL Monitoring 2

In Percona Monitoring and Management, we often use the concept of “Load” – which roughly corresponds to the number of operations of a type in progress. This graph shows us what statements contribute the most load on the system, as well as what load corresponds to the Amazon Aurora transaction commits (which we observed in the graph before).

Amazon Aurora MySQL Memory Usage

Amazon Aurora MySQL Monitoring 3

This graph is pretty self-explanatory. It shows how much memory is used by the Amazon Aurora lock manager, as well as the amount of memory used by Amazon Aurora to store Data Dictionary.

Amazon Aurora MySQL Statement Latency

Amazon Aurora MySQL Monitoring 4

This graph shows the average latency for the most important types of statements. Latency spikes, as shown in this example, are often indicative of the instance overload.

Amazon Aurora MySQL Special Command Counters

Amazon Aurora MySQL Monitoring 5

Amazon Aurora MySQL allows a number of commands that are not available in standard MySQL. This graph shows the usage of such commands. Regular “unit_test” calls can be seen in the default Amazon Aurora install, and the rest depends on your workload.

Amazon Aurora MySQL Problems

Amazon Aurora MySQL Monitoring 6

This graph is where you want to see a flat line. It shows different kinds of internal Amazon Aurora MySQL problems, which in normal operation should generally be zero.

I hope you find these Amazon Aurora MySQL monitoring improvements useful. Let us know if there is any other Amazon Aurora information that would be helpful to display!

This Week in Data with Colin Charles 28: Percona Live, MongoDB Transactions and Spectre/Meltdown Rumble On

Colin Charles

Colin CharlesJoin Percona Chief Evangelist Colin Charles as he covers happenings, gives pointers and provides musings on the open source database community.

In case you missed last week’s column, don’t forget to read the fairly lengthy FOSDEM MySQL & Friends DevRoom summary.

From a Percona Live Santa Clara 2018 standpoint, beyond the tutorials getting picked and scheduled, the talks have also been picked and scheduled (so you were very likely getting acceptance emails from the Hubb.me system by Tuesday). The rejections have not gone out yet but will follow soon. I expect the schedule to go live either today (end of week) or early next week. Cheapest tickets end March 4, so don’t wait to register!

Amazon Relational Database Service has had a lot of improvements in 2017, and the excellent summary from Jeff Barr is worth a read: Amazon Relational Database Service – Looking Back at 2017. Plenty of improvements for the MySQL, MariaDB Server, PostgreSQL and Aurora worlds.

Spectre/Meltdown and its impact are still being discovered. You need to read Brendan Gregg’s amazing post: KPTI/KAISER Meltdown Initial Performance Regressions. And if you visit Percona Live, you’ll see an amazing keynote from him too! Are you still using MyISAM? MyISAM and KPTI – Performance Implications From The Meltdown Fix suggests switching to Aria or InnoDB.

Probably the biggest news this week though? Transactions are coming to MongoDB 4.0. From the site, “MongoDB 4.0 will add support for multi-document transactions, making it the only database to combine the speed, flexibility, and power of the document model with ACID guarantees. Through snapshot isolation, transactions will provide a globally consistent view of data, and enforce all-or-nothing execution to maintain data integrity.”. You want to read the blog post, MongoDB Drops ACID (the title works if you’re an English native speaker, but maybe not quite if you aren’t). The summary diagram was a highlight for me because you can see the building blocks, plus future plans for MongoDB 4.2.

Releases

Link List

Upcoming appearances

  • SCALE16x – Pasadena, California, USA – March 8-11 2018
  • FOSSASIA 2018 – Singapore – March 22-25 2018

Feedback

I look forward to feedback/tips via e-mail at colin.charles@percona.com or on Twitter @bytebot.