One of the great things about Percona Monitoring and Management (PMM) is its flexibility. An example of that is how one can go beyond the exporters to collect data. One approach to achieve that is using textfile collectors, as explained in Extended Metrics for Percona Monitoring and Management without modifying the Code. Another method, whiceeeh is the subject matter of this post, is to use custom queries.
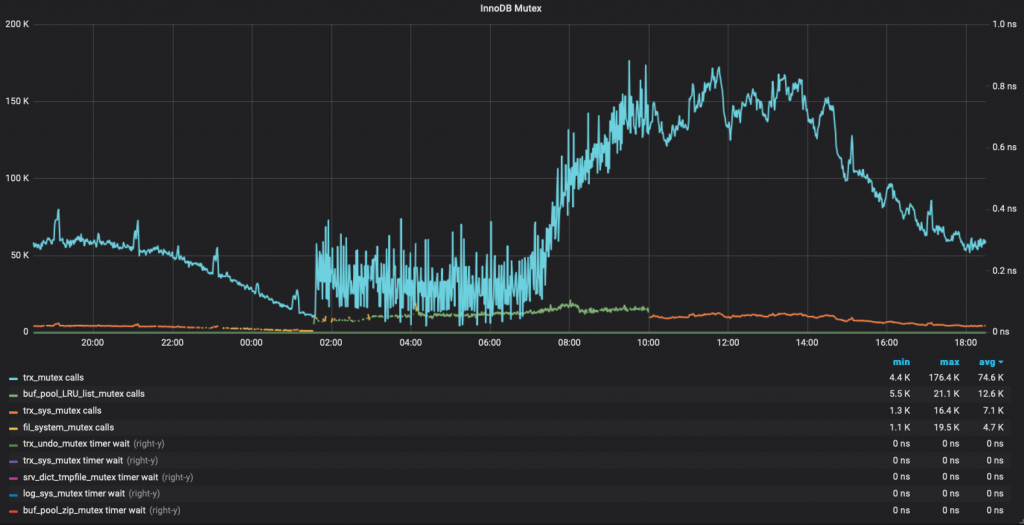
While working on a customer’s contention issue I wanted to check the behaviour of InnoDB Mutexes over time. Naturally, I went straight to PMM and didn’t find a graph suitable for my needs. No graph, no problem! Luckily anyone can enhance PMM. So here’s how I made the graph I needed.
The final result will looks like this:

Custom Queries
What is it?
Starting from the version 1.15.0, PMM provides user the ability to take a SQL SELECT statement and turn the resultset into a metric series in PMM. That is custom queries.
How do I enable that feature?
This feature is ON by default. You only need to edit the configuration file using YAML syntax
Where is the configuration file located?
Config file location is /usr/local/percona/pmm-client/queries-mysqld.yml by default. You can change it when adding mysql metrics via pmm-admin:
pmm-admin add mysql:metrics ... -- --queries-file-name=/usr/local/percona/pmm-client/query.yml
How often is data being collected?
The queries are executed at the LOW RESOLUTION level, which by default is every 60 seconds.
InnoDB Mutex monitoring
The method used to gather Mutex status is querying the PERFORMANCE SCHEMA, as explained here: https://dev.mysql.com/doc/refman/5.7/en/monitor-innodb-mutex-waits-performance-schema.html but intentionally removed the SUM_TIMER_WAIT > 0 condition, so the query used looks like this:
SELECT
EVENT_NAME, COUNT_STAR, SUM_TIMER_WAIT
FROM performance_schema.events_waits_summary_global_by_event_name
WHERE EVENT_NAME LIKE 'wait/synch/mutex/innodb/%'
For this query to return data, some requirements need to be met:
- The most important one: Performance Schema needs to be enabled
- Consumers for “event_waits” enabled
- Instruments for ‘wait/synch/mutex/innodb’ enabled.
If performance schema is enabled, the other two requirements are met by running these two queries:
update performance_schema.setup_instruments set enabled='YES' where name like 'wait/synch/mutex/innodb%';
update performance_schema.setup_consumers set enabled='YES' where name like 'events_waits%';
YAML Configuration File
This is where the magic happens. Explanation of the YAML syntax is covered in deep on the documentation: https://www.percona.com/doc/percona-monitoring-and-management/conf-mysql.html#pmm-conf-mysql-executing-custom-queries
The one used for this issue is:
---
mysql_global_status_innodb_mutex:
    query: "SELECT EVENT_NAME, COUNT_STAR, SUM_TIMER_WAIT FROM performance_schema.events_waits_summary_global_by_event_name WHERE EVENT_NAME LIKE 'wait/synch/mutex/innodb/%'"
    metrics:
      - EVENT_NAME:
          usage: "LABEL"
          description: "Name of the mutex"
      - COUNT_STAR:
          usage: "COUNTER"
          description: "Number of calls"
      - SUM_TIMER_WAIT:
          usage: "GAUGE"
          description: "Duration"
The key info is:
- The metric name is mysql_global_status_innodb_mutex
- Since EVENT_NAME is used as a label, it will be possible to have values per event
Remember that this should be in the queries-mysql.yml file. Full path /usr/local/percona/pmm-client/queries-mysqld.yml inside the db node.
Once that is done, you will start to have those metrics available in Prometheus. Now, we have a graph to do!
Creating the graph in Grafana
Before jumping to grafana to add the graph, we need a proper Prometheus Query (A.K.A: PromQL). I came up with these two (one for the count_star, one for the sum_timer_wait):
topk(5, label_replace(rate(mysql_global_status_innodb_mutex_COUNT_STAR{instance="$host"}[$interval]), "mutex", "$2", "EVENT_NAME", "(.*)/(.*)" ) or label_replace(irate(mysql_global_status_innodb_mutex_COUNT_STAR{instance="$host"}[5m]), "mutex", "$2", "EVENT_NAME", "(.*)/(.*)" ))and
topk(5, label_replace(rate(mysql_global_status_innodb_mutex_SUM_TIMER_WAIT{instance="$host"}[$interval]), "mutex", "$2", "EVENT_NAME", "(.*)/(.*)" ) or label_replace(irate(mysql_global_status_innodb_mutex_SUM_TIMER_WAIT{instance="$host"}[5m]), "mutex", "$2", "EVENT_NAME", "(.*)/(.*)" ))These queries are basically: Return the rate values of each mutex event for a specific host. And make some regex to return only the name of the event, and discard whatever is before the last slash character.
Once we are good with our PromQL queries, we can go and add the graph.
Finally, I got the graph that I needed with a very small effort.
The dashboard is also published on the Grafana Labs Community dashboards site.
Summary
PMM’s collection of graphs and dashboard is quite complete, but it is also natural that there are specific metrics that might not be there. For those cases, you can count on the flexibility and ease usage of PMM to collect metrics and create custom graphs. So go ahead, embrace PMM, customize it, make it yours!
The JSON for this graph, so it can be imported easily, is:
{
  "aliasColors": {},
  "bars": false,
  "dashLength": 10,
  "dashes": false,
  "datasource": "Prometheus",
  "fill": 0,
  "gridPos": {
    "h": 18,
    "w": 24,
    "x": 0,
    "y": 72
  },
  "id": null,
  "legend": {
    "alignAsTable": true,
    "avg": true,
    "current": false,
    "max": true,
    "min": true,
    "rightSide": false,
    "show": true,
    "sideWidth": 0,
    "sort": "avg",
    "sortDesc": true,
    "total": false,
    "values": true
  },
  "lines": true,
  "linewidth": 2,
  "links": [],
  "nullPointMode": "null",
  "percentage": false,
  "pointradius": 0.5,
  "points": false,
  "renderer": "flot",
  "seriesOverrides": [
    {
      "alias": "/Timer Wait/i",
      "yaxis": 2
    }
  ],
  "spaceLength": 10,
  "stack": false,
  "steppedLine": false,
  "targets": [
    {
      "expr": "topk(5, label_replace(rate(mysql_global_status_innodb_mutex_COUNT_STAR{instance="$host"}[$interval]), "mutex", "$2", "EVENT_NAME", "(.*)/(.*)" )) or topk(5,label_replace(irate(mysql_global_status_innodb_mutex_COUNT_STAR{instance="$host"}[5m]), "mutex", "$2", "EVENT_NAME", "(.*)/(.*)" ))",
      "format": "time_series",
      "interval": "$interval",
      "intervalFactor": 1,
      "legendFormat": "{{ mutex }} calls",
      "refId": "A",
      "hide": false
    },
    {
      "expr": "topk(5, label_replace(rate(mysql_global_status_innodb_mutex_SUM_TIMER_WAIT{instance="$host"}[$interval]), "mutex", "$2", "EVENT_NAME", "(.*)/(.*)" )) or topk(5, label_replace(irate(mysql_global_status_innodb_mutex_SUM_TIMER_WAIT{instance="$host"}[5m]), "mutex", "$2", "EVENT_NAME", "(.*)/(.*)" ))",
      "format": "time_series",
      "interval": "$interval",
      "intervalFactor": 1,
      "legendFormat": "{{ mutex }} timer wait",
      "refId": "B",
      "hide": false
    }
  ],
  "thresholds": [],
  "timeFrom": null,
  "timeShift": null,
  "title": "InnoDB Mutex",
  "tooltip": {
    "shared": true,
    "sort": 2,
    "value_type": "individual"
  },
  "transparent": false,
  "type": "graph",
  "xaxis": {
    "buckets": null,
    "mode": "time",
    "name": null,
    "show": true,
    "values": []
  },
  "yaxes": [
    {
      "format": "short",
      "label": "",
      "logBase": 1,
      "max": null,
      "min": null,
      "show": true
    },
    {
      "decimals": null,
      "format": "ns",
      "label": "",
      "logBase": 1,
      "max": null,
      "min": "0",
      "show": true
    }
  ],
  "yaxis": {
    "align": false,
    "alignLevel": null
  }
}