Percona’s Open Source Data Management Software Survey

PerconaSurvey

Click Here to Complete our New Survey!

Last year we informally surveyed the open source community and our conference attendees.
The results revealed that:

  • 48% of those in the cloud choose to self-manage their databases, but 52% were comfortable relying on the DBaaS offering of their cloud vendor.
  • 49% of people said “performance issues” when asked, “what keeps you up at night?”
  • The major decision influence for buying services was price, with 42% of respondents keen to make the most of their money.

We found this information so interesting that we wanted to find out more! As a result, we are pleased to announce the launch of our first annual Open Source Data Management Software Survey.

The final results will be 100% anonymous, and will be made freely available on Creative Commons.

How Will This Survey Help The Community?

Unlimited access to accurate market data is important. Millions of open source projects are in play, and most are dependent on databases. Accurate market data helps you track the popularity of different databases, as well as seeing how and where these databases are run. This helps us all build better software and take advantage of shifting trends.

Thousands of vendors are focused on helping SysAdmins, DBAs, and Developers get the most out of their database infrastructure. Insightful market data enables them to create better tools that meet current demands and grow the open source database market.

We want to assist companies who are still deciding what, how, and where to run their systems. This information will help them understand the industry direction and allow them to make an informed decision on the software and services they choose.

How Can You Help Make This Survey A Success?

Firstly, please share your insight into current trends and new developments in open source data management software.

Secondly, please share this survey with other people who work in the industry, and encourage them to contribute.

The more responses we receive, the more useful this will be to the whole open source community. If we missed anything, or you would like to ask other questions in future, let us know!

So tell us; who are the big fish, and which minnows are nibbling at their tails?! Is the cloud giving you altitude sickness, or are you flying high? What is the next big thing and is everyone on board, or is your company lagging behind?

Preliminary results will be presented at our annual Percona Live Conference in Austin, Texas (May 28-30, 2019) by our CEO, Peter Zaitsev and released to the open source community when finalized.

Click Here to Have Your Say!

PostgreSQL Upgrade Using pg_dumpall

migrating PostgreSQL using pg_dumpall

PostgreSQL logoThere are several approaches to assess when you need to upgrade PostgreSQL. In this blog post, we look at the option for upgrading a postgres database using pg_dumpall. As this tool can also be used to back up PostgreSQL clusters, then it is a valid option for upgrading a cluster too. We consider the advantages and disadvantages of this approach, and show you the steps needed to achieve the upgrade.

This is the first of our Upgrading or Migrating Your Legacy PostgreSQL to Newer PostgreSQL Versions series where we’ll be exploring different paths to accomplish postgres upgrade or migration. The series will culminate with a practical webinar to be aired April 17th (you can register here).

We begin this journey by providing you the most straightforward way to carry on with a PostgreSQL upgrade or migration: by rebuilding the entire database from a logical backup.

Defining the scope

Let’s define what we mean by upgrading or migrating PostgreSQL using pg_dumpall.

If you need to perform a PostgreSQL upgrade within the same database server, we’d call that an in-place upgrade or just an upgrade. Whereas a procedure that involves migrating your PostgreSQL server from one server to another server, combined with an upgrade from an older version (let’s say 9.3) to a newer version PostgreSQL (say PG 11.2), can be considered a migration.

There are two ways to achieve this requirement using logical backups :

  1. Using pg_dumpall
  2. Using pg_dumpall + pg_dump + pg_restore

We’ll be discussing the first option (pg_dumpall) here, and will leave the discussion of the second option for our next post.

pg_dumpall

pg_dumpall can be used to obtain a text-format dump of the whole database cluster, and which includes all databases in the cluster. This is the only method that can be used to backup globals such as users and roles in PostgreSQL.

There are, of course, advantages and disadvantages in employing this approach to upgrading PostgreSQL by rebuilding the database cluster using pg_dumpall.

Advantages of using pg_dumpall for upgrading a PostgreSQL server :

  1. Works well for a tiny database cluster.
  2. Upgrade can be completed using just a few commands.
  3. Removes bloat from all the tables and shrinks the tables to their absolute sizes.

Disadvantages of using pg_dumpall for upgrading a PostgreSQL server :

  1. Not the best option for databases that are huge in size as it might involve more downtime. (Several GB’s or TB’s).
  2. Cannot use parallel mode. Backup/restore can use just one process.
  3. Requires double the space on disk as it involves temporarily creating a copy of the database cluster for an in-place upgrade.

Let’s look at the steps involved in performing an upgrade using pg_dumpall:

  1. Install new PostgreSQL binaries in the target server (which could be the same one as the source database server if it is an in-place upgrade).

    -- For a RedHat family OS
    # yum install postgresql11*
    Or
    -- In an Ubuntu/Debian OS
    # apt install postgresql11
  2. Shutdown all the writes to the database server to avoid data loss/mismatch between the old and new version after upgrade.
  3. If you are doing an upgrade within the same server, create a cluster using the new binaries on a new data directory and start it using a port other than the source. For example, if the older version PostgreSQL is running on port 5432, start the new cluster on port 5433. If you are upgrading and migrating the database to a different server, create a new cluster using new binaries on the target server – the cluster may not need to run on a different port other than the default, unless that’s your preference.

    $ /usr/pgsql-11/bin/initdb -D new_data_directory
    $ cd new_data_directory
    $ echo “port = 5433” >> postgresql.auto.conf
    $ /usr/pgsql-11/bin/pg_ctl -D new_data_directory start
  4. You might have a few extensions installed in the old version PostgreSQL cluster. Get the list of all the extensions created in the source database server and install them for the new versions. You can exclude those you get with the contrib module by default. To see the list of extensions created and installed in your database server, you can run the following command.

    $ psql -d dbname -c "dx"

    Please make sure to check all the databases in the cluster as the extensions you see in one database may not match the list of those created in another database.

  5. Prepare a postgresql.conf file for the new cluster. Carefully prepare this by looking at the existing configuration file of the older version postgres server.
  6. Use pg_dumpall to take a cluster backup and restore it to the new cluster.

    -- Command to dump the whole cluster to a file.
    $ /usr/pgsql-11/bin/pg_dumpall > /tmp/dumpall.sql
    -- Command to restore the dump file to the new cluster (assuming it is running on port 5433 of the same server).
    $ /usr/pgsql-11/bin/psql -p 5433 -f /tmp/dumpall.sql

    Note that i have used the new pg_dumpall from the new binaries to take a backup.
    Another, easier, way is to use PIPE to avoid the time involved in creating a dump file. Just add a hostname if you are performing an upgrade and migration.

    $ pg_dumpall -p 5432 | psql -p 5433
    Or
    $ pg_dumpall -p 5432 -h source_server | psql -p 5433 -h target_server
  7. Run ANALYZE to update statistics of each database on the new server.
  8. Restart the database server using the same port as the source.

Our next post in this series provides a similar way of upgrading your PostgreSQL server while at the same time providing some flexibility to carry on with changes like the ones described above. Stay tuned!


Image based on photo by Sergio Ortega on Unsplash

Using pg_repack to Rebuild PostgreSQL Database Objects Online

Rebuild PostgreSQL Database Objects

Rebuild PostgreSQL Database ObjectsIn this blog post, we’ll look at how to use

pg_repack

 to rebuild PostgreSQL database objects online.

We’ve seen a lot of questions regarding the options available in PostgreSQL for rebuilding a table online. We created this blog post to explain the 

pg_repack

 extension, available in PostgreSQL for this requirement. pg_repack is a well-known extension that was created and is maintained as an open source project by several authors.

There are three main reasons why you need to use

pg_repack

 in a PostgreSQL server:

  1. Reclaim free space from a table to disk, after deleting a huge chunk of records
  2. Rebuild a table to re-order the records and shrink/pack them to lesser number of pages. This may let a query fetch just one page  ( or < n pages) instead of n pages from disk. In other words, less IO and more performance.
  3. Reclaim free space from a table that has grown in size with a lot of bloat due to improper autovacuum settings.

You might have already read our previous articles that explained what bloat is, and discussed the internals of autovacuum. After reading these articles, you can see there is an autovacuum background process that removes dead tuples from a table and allows the space to be re-used by future updates/inserts on that table. Over a period of time, tables that take the maximum number of updates or deletes may have a lot of bloated space due to poorly tuned autovacuum settings. This leads to slow performing queries on these tables. Rebuilding the table is the best way to avoid this. 

Why is just autovacuum not enough for tables with bloat?

We have discussed several parameters that change the behavior of an autovacuum process in this blog post. There cannot be more than

autovacuum_max_workers

 number of autovacuum processes running in a database cluster at a time. At the same time, due to untuned autovacuum settings and no manual vacuuming of the database as a weekly or monthy jobs, many tables can be skipped from autovacuum. We have discussed in this post that the default autovacuum settings run autovacuum on a table with ten records more times than a table with a million records. So, it is very important to tune your autovacuum settings, set table-level customized autovacuum parameters and enable automated jobs to identify tables with huge bloat and run manual vacuum on them as scheduled jobs during low peak times (after thorough testing).

VACUUM FULL

VACUUM FULL

 is the default option available with a PostgreSQL installation that allows us to rebuild a table. This is similar to

ALTER TABLE

 in MySQL. However, this command acquires an exclusive lock and locks reads and writes on a table. 

VACUUM FULL tablename;

pg_repack

pg_repack

 is an extension available for PostgreSQL that helps us rebuild a table online. This is similar to

pt-online-schema-change

 for online table rebuild/reorg in MySQL. However,

pg_repack

 works for tables with a Primary key or a NOT NULL Unique key only.

Installing pg_repack extension

In RedHat/CentOS/OEL from PGDG Repo

Obtain the latest PGDG repo from https://yum.postgresql.org/ and perform the following step:

# yum install pg_repack11 (This works for PostgreSQL 11)
Similarly, for PostgreSQL 10,
# yum install pg_repack10

In Debian/Ubuntu from PGDG repo

Add certificates, repo and install

pg_repack

:

Following certificate may change. Please validate before you perform these steps.
# sudo apt-get install wget ca-certificates
# wget --quiet -O - https://www.postgresql.org/media/keys/ACCC4CF8.asc | sudo apt-key add -
# sudo sh -c 'echo "deb http://apt.postgresql.org/pub/repos/apt/ $(lsb_release -cs)-pgdg main" > /etc/apt/sources.list.d/pgdg.list'
# sudo apt-get update
# apt-get install postgresql-server-dev-11
# apt-get install postgresql-11-repack

Loading and creating pg_repack extension

Step 1 :

You need to add

pg_repack

to

shared_preload_libraries

. For that, just set this parameter in postgresql.conf or postgresql.auto.conf file.

shared_preload_libraries = 'pg_repack'

Setting this parameter requires a restart.

$ pg_ctl -D $PGDATA restart -mf

Step 2 :

In order to start using

pg_repack

, you must create this extension in each database where you wish to run it:

$ psql
c percona
CREATE EXTENSION pg_repack;

Using pg_repack to Rebuild Tables Online

Similar to

pt-online-schema-change

, you can use the option

--dry-run

 to see if this table can be rebuilt using

pg_repack

. When you rebuild a table using

pg_repack

, all its associated Indexes does get rebuild automatically. You can also use

-t

 instead of

--table

 as an argument to rebuild a specific table.

Success message you see when a table satisfies the requirements for pg_repack.

$ pg_repack --dry-run -d percona --table scott.employee
INFO: Dry run enabled, not executing repack
INFO: repacking table "scott.employee"

Error message when a table does not satisfy the requirements for pg_repack.

$ pg_repack --dry-run -d percona --table scott.sales
INFO: Dry run enabled, not executing repack
WARNING: relation "scott.sales" must have a primary key or not-null unique keys

Now to execute the rebuild of a table: scott.employee ONLINE, you can use the following command. It is just the previous command without

--dry-run

.

$ pg_repack -d percona --table scott.employee
INFO: repacking table "scott.employee"

Rebuilding Multiple Tables using pg_repack

Use an additional

--table

 for each table you wish to rebuild.

Dry Run

$ pg_repack --dry-run -d percona --table scott.employee --table scott.departments
INFO: Dry run enabled, not executing repack
INFO: repacking table "scott.departments"
INFO: repacking table "scott.employee"

Execute

$ pg_repack -d percona --table scott.employee --table scott.departments
INFO: repacking table "scott.departments"
INFO: repacking table "scott.employee"

Rebuilding an entire Database using pg_repack

You can rebuild an entire database online using

-d

. Any table that is not eligible for

pg_repack

is skipped automatically.

Dry Run

$ pg_repack --dry-run -d percona
INFO: Dry run enabled, not executing repack
INFO: repacking table "scott.departments"
INFO: repacking table "scott.employee"

Execute

$ pg_repack -d percona
INFO: repacking table "scott.departments"
INFO: repacking table "scott.employee"


Running pg_repack in parallel jobs

To perform a parallel rebuild of a table, you can use the option

-j

. Please ensure that you have sufficient free CPUs that can be allocated to run

pg_repack

in parallel.

$ pg_repack -d percona -t scott.employee -j 4
NOTICE: Setting up workers.conns
INFO: repacking table "scott.employee"

Running pg_repack remotely

You can always run

pg_repack

from a Remote Machine. This helps in scenarios where we have PostgreSQL databases deployed on Amazon RDS. To run

pg_repack

from a remote machine, you must have the same version of

pg_repack

installed in the remote server as well as the database server (say AWS RDS).

plprofiler – Getting a Handy Tool for Profiling Your PL/pgSQL Code

plprofiler postgres performance tool

PostgreSQL is emerging as the standard destination for database migrations from proprietary databases. As a consequence, there is an increase in demand for database side code migration and associated performance troubleshooting. One might be able to trace the latency to a plsql function, but explaining what happens within a function could be a difficult question. Things get messier when you know the function call is taking time, but within that function there are calls to other functions as part of its body. It is a very challenging question to identify which line inside a function—or block of code—is causing the slowness. In order to answer such questions, we need to know how much time an execution spends on each line or block of code. The plprofiler project provides great tooling and extensions to address such questions.

Demonstration of plprofiler using an example

The plprofiler source contains a sample for testing plprofiler. This sample serves two purposes. It can be used for testing the configuration of plprofiler, and it is great place to see how to do the profiling of a nested function call. Files related to this can be located inside the “examples” directory. Don’t worry—I’ll be running through the installation of plprofiler later in this article.

$ cd examples/

The example expects you to create a database with name “pgbench_plprofiler”

postgres=# CREATE DATABASE pgbench_plprofiler;
CREATE DATABASE

The project provides a shell script along with a source tree to test plprofiler functionality. So testing is just a matter of running the shell script.

$ ./prepdb.sh
dropping old tables...
....

Running session level profiling

This profiling uses session level local-data. By default the plprofiler extension collects runtime data in per-backend hashtables (in-memory). This data is only accessible in the current session, and is lost when the session ends or the hash tables are explicitly reset. plprofiler’s run command will execute the plsql code and capture the profile information.

This is illustrated by below example,

$ plprofiler run --command "SELECT tpcb(1, 2, 3, -42)" -d pgbench_plprofiler --output tpcb-test1.html
SELECT tpcb(1, 2, 3, -42)
-- row1:
tpcb: -42
----
(1 rows)
SELECT 1 (0.073 seconds)

What happens during above plprofiler command run can be summarised in 3 steps:

  1. A function call with four parameters “SELECT tpcb(1, 2, 3, -42)” is presented to the plprofiler tool for execution.
  2. plprofiler establishes a connection to PostgreSQL and executes the function
  3. The tool collects the profile information captured in the local-data hash tables and generates an HTML report “tpcb-test1.html”

Global profiling

As mentioned previously, this method is useful if we want to profile the function executions in other sessions or on the entire database. During global profiling, data is captured into a shared-data hash table which is accessible for all sessions in the database. The plprofiler extension periodically copies the local-data from the individual sessions into shared hash tables, to make the statistics available to other sessions. See the

plprofiler monitor

  command, below, for details. This data still relies on the local database system catalog to resolve Oid values into object definitions.

In this example, the plprofiler tool will be running in monitor mode for a duration of 60 seconds. Every 10 seconds, the tool copies data from local-data to shared-data.

$ plprofiler monitor --interval=10 --duration=60 -d pgbench_plprofiler
monitoring for 60 seconds ...
done.

For testing purposes you can start executing a few functions at the same time.

Once the data is captured into shared-data, we can generate a report. For example:

$ plprofiler report --from-shared --title=MultipgMax --output=MultipgMax.html -d pgbench_plprofiler

The data in shared-data will be retained until it’s explicitly cleared using the

plprofiler reset

  command

$ plprofiler reset

If there is no profile data present in the shared hash tables, execution of the report will result in error message.

$ plprofiler report --from-shared --title=MultipgMax --output=MultipgMax.html
Traceback (most recent call last):
File "/usr/bin/plprofiler", line 11, in <module>
load_entry_point('plprofiler==4.dev0', 'console_scripts', 'plprofiler')()
File "/usr/lib/python2.7/site-packages/plprofiler-4.dev0-py2.7.egg/plprofiler/plprofiler_tool.py", line 67, in main
return report_command(sys.argv[2:])
File "/usr/lib/python2.7/site-packages/plprofiler-4.dev0-py2.7.egg/plprofiler/plprofiler_tool.py", line 493, in report_command
report_data = plp.get_shared_report_data(opt_name, opt_top, args)
File "/usr/lib/python2.7/site-packages/plprofiler-4.dev0-py2.7.egg/plprofiler/plprofiler.py", line 555, in get_shared_report_data
raise Exception("No profiling data found")
Exception: No profiling data found

Report on profile information

The HTML report generated by plprofiler is a self-contained HTML document and it gives detailed information about the PL/pgSQL function execution. There will be a clickable FlameGraph at the top of the report with details about functions in the profile. The plprofiler FlameGraph is based on the actual Wall-Clock time spent in the PL/pgSQL functions. By default, plprofiler provides details on the top ten functions, based on their self_time (total_time – children_time).

This section of the report is followed by tabular representation of function calls. For example:
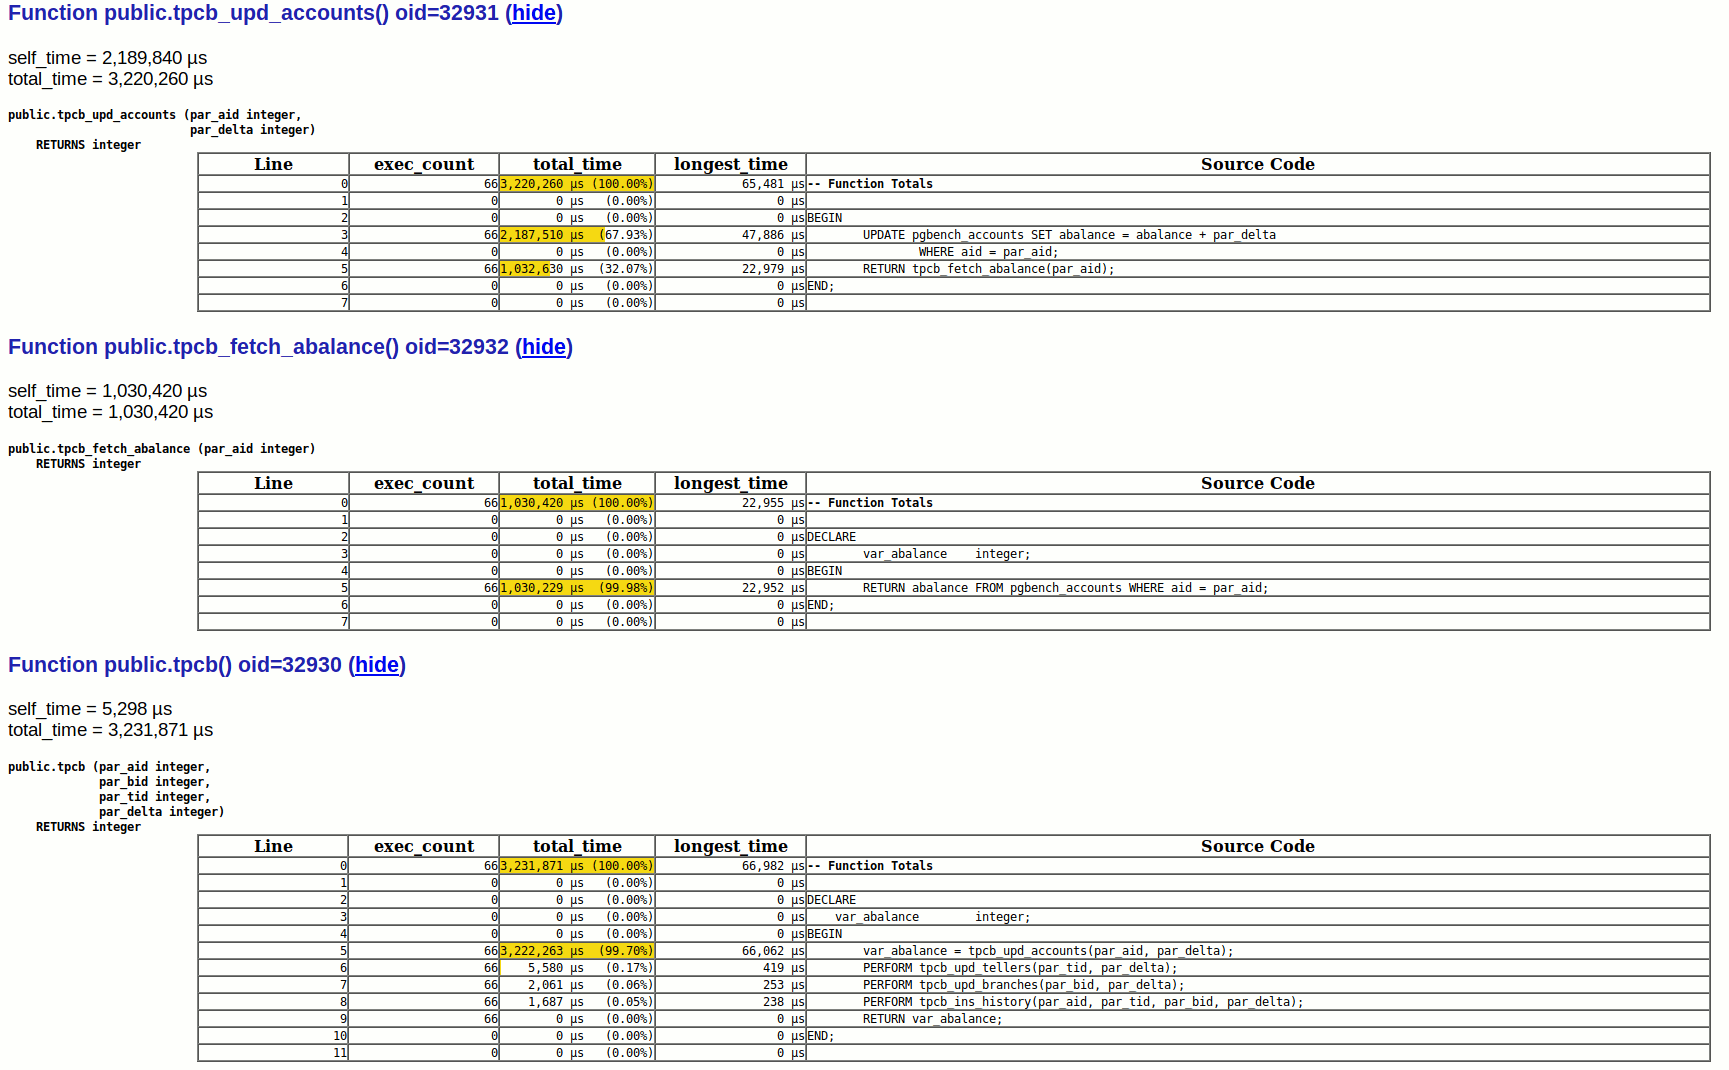
This gives a lot of detailed information such as execution counts and time spend against each line of code.

Binary Packages

Binary distributions of plprofiler are not common. However the BigSQL project provides plprofiler packages as an easy to use bundle. Such ready-to-use packages are one of the reasons for BigSQL to remain as one of the most developer friendly PostgreSQL distributions. The first screen of Package manager installation of BigSQL provided me with the information I am looking for:


Appears that there was a recent release of BigSQL packages and plprofiler is an updated package within that.

Installation and configuration is made simple:

$ ./pgc install plprofiler-pg11
['plprofiler-pg11']
File is already downloaded.
Unpacking plprofiler-pg11-3.3-1-linux64.tar.bz2
install-plprofiler-pg11...
Updating postgresql.conf file:
old: #shared_preload_libraries = '' # (change requires restart)
new: shared_preload_libraries = 'plprofiler'

As we can see, even PostgreSQL parameters are updated to have plprofiler as a

shared_preload_library

 .  If need to use plprofiler for investigating code, these binary packages from the BigSQL project are my first preference because everything is ready to use. Definitely, this is developer-friendly.

Creation of extension and configuring the plprofiler tool

At the database level, we should create the plprofiler extension to profile the function execution. This step needs to be performed in both cases, whether we want global profiling where share_preload_libraries are set, or at session level where that is not required

postgres=# create extension plprofiler;
CREATE EXTENSION

plprofiler is not just an extension, but comes with tooling to invoke profiling or to generate reports. These scripts are primarily coded in Python and uses psycopg2 to connect to PostgreSQL. The python code is located inside the “python-plprofiler” directory of the source tree. There are a few perl dependencies too which will be resolved as part of installation

sudo yum install python-setuptools.noarch
sudo yum install python-psycopg2
cd python-plprofiler/
sudo python ./setup.py install

Building from source

If you already have a PostgreSQL instance running using binaries from PGDG repository OR you want to wet your hands by building everything from source, then installation needs a different approach. I have PostgreSQL 11 already running on the system. The first step is to get the corresponding development packages which have all the header files and libraries to support a build from source. Obviously this is the thorough way of getting plprofiler working.

$ sudo yum install postgresql11-devel

We need to have build tools, and since the core of plprofiler is C code, we have to install a C compiler and make utility.

$ sudo yum install gcc make

Preferably, we should build plprofiler using the same OS user that runs PostgreSQL server, which is “postgres” in most environments. Please make sure that all PostgreSQL binaries are available in the path and that you are able to execute the pg_config, which lists out build related information:

$ pg_config
BINDIR = /usr/pgsql-11/bin
..
INCLUDEDIR = /usr/pgsql-11/include
PKGINCLUDEDIR = /usr/pgsql-11/include
INCLUDEDIR-SERVER = /usr/pgsql-11/include/server
LIBDIR = /usr/pgsql-11/lib
PKGLIBDIR = /usr/pgsql-11/lib
LOCALEDIR = /usr/pgsql-11/share/locale
MANDIR = /usr/pgsql-11/share/man
SHAREDIR = /usr/pgsql-11/share
SYSCONFDIR = /etc/sysconfig/pgsql
PGXS = /usr/pgsql-11/lib/pgxs/src/makefiles/pgxs.mk
CONFIGURE = '--enable-rpath' '--prefix=/usr/pgsql-11' '--includedir=/usr/pgsql-11/include' '--mandir=/usr/pgsql-11/share/man' '--datadir=/usr/pgsql-11/share' '--with-icu' 'CLANG=/opt/rh/llvm-toolset-7/root/usr/bin/clang' 'LLVM_CONFIG=/usr/lib64/llvm5.0/bin/llvm-config' '--with-llvm' '--with-perl' '--with-python' '--with-tcl' '--with-tclconfig=/usr/lib64' '--with-openssl' '--with-pam' '--with-gssapi' '--with-includes=/usr/include' '--with-libraries=/usr/lib64' '--enable-nls' '--enable-dtrace' '--with-uuid=e2fs' '--with-libxml' '--with-libxslt' '--with-ldap' '--with-selinux' '--with-systemd' '--with-system-tzdata=/usr/share/zoneinfo' '--sysconfdir=/etc/sysconfig/pgsql' '--docdir=/usr/pgsql-11/doc' '--htmldir=/usr/pgsql-11/doc/html' 'CFLAGS=-O2 -g -pipe -Wall -Wp,-D_FORTIFY_SOURCE=2 -fexceptions -fstack-protector-strong --param=ssp-buffer-size=4 -grecord-gcc-switches -m64 -mtune=generic' 'LDFLAGS=-Wl,--as-needed' 'PKG_CONFIG_PATH=:/usr/lib64/pkgconfig:/usr/share/pkgconfig'
CC = gcc
...
VERSION = PostgreSQL 11.1

Now we’re ready to get the source code and build it. You should be able to checkout the git repository for plprofiler.

$ git clone https://github.com/pgcentral/plprofiler.git
Cloning into 'plprofiler'...
...

Building against PostgreSQL 11 binaries from PGDG can be a bit complicated because of th JIT feature. Configuration flag

--with-llvm

  will be enabled. So we may have to have LLVM present in the system as detailed in my previous blog about JIT in PostgreSQL11

Once we’re ready, we can move to the plprofiler directory and build it:

$ cd plprofiler
$ make USE_PGXS=1
--- Output ----
gcc -Wall -Wmissing-prototypes -Wpointer-arith -Wdeclaration-after-statement -Wendif-labels -Wmissing-format-attribute -Wformat-security -fno-strict-aliasing -fwrapv -fexcess-precision=standard -O2 -g -pipe -Wall -Wp,-D_FORTIFY_SOURCE=2 -fexceptions -fstack-protector-strong --param=ssp-buffer-size=4 -grecord-gcc-switches -m64 -mtune=generic -fPIC -I. -I./ -I/usr/pgsql-11/include/server -I/usr/pgsql-11/include/internal -D_GNU_SOURCE -I/usr/include/libxml2 -I/usr/include -c -o plprofiler.o plprofiler.c
gcc -Wall -Wmissing-prototypes -Wpointer-arith -Wdeclaration-after-statement -Wendif-labels -Wmissing-format-attribute -Wformat-security -fno-strict-aliasing -fwrapv -fexcess-precision=standard -O2 -g -pipe -Wall -Wp,-D_FORTIFY_SOURCE=2 -fexceptions -fstack-protector-strong --param=ssp-buffer-size=4 -grecord-gcc-switches -m64 -mtune=generic -fPIC -shared -o plprofiler.so plprofiler.o -L/usr/pgsql-11/lib -Wl,--as-needed -L/usr/lib64/llvm5.0/lib -L/usr/lib64 -Wl,--as-needed -Wl,-rpath,'/usr/pgsql-11/lib',--enable-new-dtags
/opt/rh/llvm-toolset-7/root/usr/bin/clang -Wno-ignored-attributes -fno-strict-aliasing -fwrapv -O2 -I. -I./ -I/usr/pgsql-11/include/server -I/usr/pgsql-11/include/internal -D_GNU_SOURCE -I/usr/include/libxml2 -I/usr/include -flto=thin -emit-llvm -c -o plprofiler.bc plprofiler.c

Now we should be able to install this extension:

$ sudo make USE_PGXS=1 install
--- Output ----
/usr/bin/mkdir -p '/usr/pgsql-11/lib'
/usr/bin/mkdir -p '/usr/pgsql-11/share/extension'
/usr/bin/install -c -m 755 plprofiler.so '/usr/pgsql-11/lib/plprofiler.so'
/usr/bin/install -c -m 644 .//plprofiler.control '/usr/pgsql-11/share/extension/'
/usr/bin/install -c -m 644 .//plprofiler--1.0--2.0.sql .//plprofiler--2.0--3.0.sql .//plprofiler--3.0.sql '/usr/pgsql-11/share/extension/'
/usr/bin/mkdir -p '/usr/pgsql-11/lib/bitcode/plprofiler'
/usr/bin/mkdir -p '/usr/pgsql-11/lib/bitcode'/plprofiler/
/usr/bin/install -c -m 644 plprofiler.bc '/usr/pgsql-11/lib/bitcode'/plprofiler/./

The above command expects all build tools to be in the proper path even with sudo.

Profiling external sessions

To profile a function executed by another session, or all other sessions, we should load the libraries at global level. In production environments, that will be the case. This can be done by adding the extension library to the

shared_preload_libraries

  specification. You won’t need this if you only want to profile functions executed within your session. Session level profiling is generally possible only in Dev/Test environments.

To enable global profiling, verify the current value of

shared_preload_libraries

  and add plprofiler to the list.

postgres=# show shared_preload_libraries ;
shared_preload_libraries
--------------------------
(1 row)
postgres=# alter system set shared_preload_libraries = 'plprofiler';
ALTER SYSTEM
postgres=#

This change requires us to restart the PostgreSQL server

$ sudo systemctl restart postgresql-11

After the restart, it’s a good idea to verify the parameter change

postgres=# show shared_preload_libraries ;
shared_preload_libraries
--------------------------
plprofiler
(1 row)

From this point onwards, the steps are same as those for the binary package setup discussed above.

Summary

plprofiler is a wonderful tool for developers. I keep seeing many users who are in real need of it. Hopefully this blog post will help those who never tried it.

Parallel queries in PostgreSQL

parallel queries in postgresql

PostgreSQL logoModern CPU models have a huge number of cores. For many years, applications have been sending queries in parallel to databases. Where there are reporting queries that deal with many table rows, the ability for a query to use multiple CPUs helps us with a faster execution. Parallel queries in PostgreSQL allow us to utilize many CPUs to finish report queries faster. The parallel queries feature was implemented in 9.6 and helps. Starting from PostgreSQL 9.6 a report query is able to use many CPUs and finish faster.

The initial implementation of the parallel queries execution took three years. Parallel support requires code changes in many query execution stages. PostgreSQL 9.6 created an infrastructure for further code improvements. Later versions extended parallel execution support for other query types.

Limitations

  • Do not enable parallel executions if all CPU cores are already saturated. Parallel execution steals CPU time from other queries, and increases response time.
  • Most importantly, parallel processing significantly increases memory usage with high WORK_MEM values, as each hash join or sort operation takes a work_mem amount of memory.
  • Next, low latency OLTP queries can’t be made any faster with parallel execution. In particular, queries that returns a single row can perform badly when parallel execution is enabled.
  • The Pierian spring for developers is a TPC-H benchmark. Check if you have similar queries for the best parallel execution.
  • Parallel execution supports only SELECT queries without lock predicates.
  • Proper indexing might be a better alternative to a parallel sequential table scan.
  • There is no support for cursors or suspended queries.
  • Windowed functions and ordered-set aggregate functions are non-parallel.
  • There is no benefit for an IO-bound workload.
  • There are no parallel sort algorithms. However, queries with sorts still can be parallel in some aspects.
  • Replace CTE (WITH …) with a sub-select to support parallel execution.
  • Foreign data wrappers do not currently support parallel execution (but they could!)
  • There is no support for FULL OUTER JOIN.
  • Clients setting max_rows disable parallel execution.
  • If a query uses a function that is not marked as PARALLEL SAFE, it will be single-threaded.
  • SERIALIZABLE transaction isolation level disables parallel execution.

Test environment

The PostgreSQL development team have tried to improve TPC-H benchmark queries’ response time. You can download the benchmark and adapt it to PostgreSQL by using these instructions. It’s not an official way to use the TPC-H benchmark, so you shouldn’t use it to compare different databases or hardware.

  1. Download TPC-H_Tools_v2.17.3.zip (or newer version) from official TPC site.
  2. Rename makefile.suite to Makefile and modify it as requested at https://github.com/tvondra/pg_tpch . Compile the code with make command
  3. Generate data: ./dbgen -s 10 generates 23GB database which is enough to see the difference in performance for parallel and non-parallel queries.
  4. Convert tbl files to csv with for + sed
  5. Clone pg_tpch repository and copy csv files to pg_tpch/dss/data
  6. Generate queries with qgen command
  7. Load data to the database with ./tpch.sh command.

Parallel sequential scan

This might be faster not because of parallel reads, but due to scattering of data across many CPU cores. Modern OS provides good caching for PostgreSQL data files. Read-ahead allows getting a block from storage more than just the block requested by PG daemon. As a result, query performance is not limited due to disk IO. It consumes CPU cycles for:

  • reading rows one by one from table data pages
  • comparing row values and WHERE conditions

Let’s try to execute simple select query:

tpch=# explain analyze select l_quantity as sum_qty from lineitem where l_shipdate <= date '1998-12-01' - interval '105' day;
QUERY PLAN
--------------------------------------------------------------------------------------------------------------------------
Seq Scan on lineitem (cost=0.00..1964772.00 rows=58856235 width=5) (actual time=0.014..16951.669 rows=58839715 loops=1)
Filter: (l_shipdate <= '1998-08-18 00:00:00'::timestamp without time zone)
Rows Removed by Filter: 1146337
Planning Time: 0.203 ms
Execution Time: 19035.100 ms

A sequential scan produces too many rows without aggregation. So, the query is executed by a single CPU core.

After adding SUM(), it’s clear to see that two workers will help us to make the query faster:

explain analyze select sum(l_quantity) as sum_qty from lineitem where l_shipdate <= date '1998-12-01' - interval '105' day;
QUERY PLAN
----------------------------------------------------------------------------------------------------------------------------------------------------
Finalize Aggregate (cost=1589702.14..1589702.15 rows=1 width=32) (actual time=8553.365..8553.365 rows=1 loops=1)
-> Gather (cost=1589701.91..1589702.12 rows=2 width=32) (actual time=8553.241..8555.067 rows=3 loops=1)
Workers Planned: 2
Workers Launched: 2
-> Partial Aggregate (cost=1588701.91..1588701.92 rows=1 width=32) (actual time=8547.546..8547.546 rows=1 loops=3)
-> Parallel Seq Scan on lineitem (cost=0.00..1527393.33 rows=24523431 width=5) (actual time=0.038..5998.417 rows=19613238 loops=3)
Filter: (l_shipdate <= '1998-08-18 00:00:00'::timestamp without time zone)
Rows Removed by Filter: 382112
Planning Time: 0.241 ms
Execution Time: 8555.131 ms

The more complex query is 2.2X faster compared to the plain, single-threaded select.

Parallel Aggregation

A “Parallel Seq Scan” node produces rows for partial aggregation. A “Partial Aggregate” node reduces these rows with SUM(). At the end, the SUM counter from each worker collected by “Gather” node.

The final result is calculated by the “Finalize Aggregate” node. If you have your own aggregation functions, do not forget to mark them as “parallel safe”.

Number of workers

We can increase the number of workers without server restart:

alter system set max_parallel_workers_per_gather=4;
select * from pg_reload_conf();
Now, there are 4 workers in explain output:
tpch=# explain analyze select sum(l_quantity) as sum_qty from lineitem where l_shipdate <= date '1998-12-01' - interval '105' day;
QUERY PLAN
----------------------------------------------------------------------------------------------------------------------------------------------------
Finalize Aggregate (cost=1440213.58..1440213.59 rows=1 width=32) (actual time=5152.072..5152.072 rows=1 loops=1)
-> Gather (cost=1440213.15..1440213.56 rows=4 width=32) (actual time=5151.807..5153.900 rows=5 loops=1)
Workers Planned: 4
Workers Launched: 4
-> Partial Aggregate (cost=1439213.15..1439213.16 rows=1 width=32) (actual time=5147.238..5147.239 rows=1 loops=5)
-> Parallel Seq Scan on lineitem (cost=0.00..1402428.00 rows=14714059 width=5) (actual time=0.037..3601.882 rows=11767943 loops=5)
Filter: (l_shipdate <= '1998-08-18 00:00:00'::timestamp without time zone)
Rows Removed by Filter: 229267
Planning Time: 0.218 ms
Execution Time: 5153.967 ms

What’s happening here? We have changed the number of workers from 2 to 4, but the query became only 1.6599 times faster. Actually, scaling is amazing. We had two workers plus one leader. After a configuration change, it becomes 4+1.

The biggest improvement from parallel execution that we can achieve is: 5/3 = 1.66(6)X faster.

How does it work?

Processes

Query execution always starts in the “leader” process. A leader executes all non-parallel activity and its own contribution to parallel processing. Other processes executing the same queries are called “worker” processes. Parallel execution utilizes the Dynamic Background Workers infrastructure (added in 9.4). As other parts of PostgreSQL uses processes, but not threads, the query creating three worker processes could be 4X faster than the traditional execution.

Communication

Workers communicate with the leader using a message queue (based on shared memory). Each process has two queues: one for errors and the second one for tuples.

How many workers to use?

Firstly, the max_parallel_workers_per_gather parameter is the smallest limit on the number of workers. Secondly, the query executor takes workers from the pool limited by max_parallel_workers size. Finally, the top-level limit is max_worker_processes: the total number of background processes.

Failed worker allocation leads to single-process execution.

The query planner could consider decreasing the number of workers based on a table or index size. min_parallel_table_scan_size and min_parallel_index_scan_size control this behavior.

set min_parallel_table_scan_size='8MB'
8MB table => 1 worker
24MB table => 2 workers
72MB table => 3 workers
x => log(x / min_parallel_table_scan_size) / log(3) + 1 worker

Each time the table is 3X bigger than min_parallel_(index|table)_scan_size, postgres adds a worker. The number of workers is not cost-based! A circular dependency makes a complex implementation hard. Instead, the planner uses simple rules.

In practice, these rules are not always acceptable in production and you can override the number of workers for the specific table with ALTER TABLE … SET (parallel_workers = N).

Why parallel execution is not used?

Besides to the long list of parallel execution limitations, PostgreSQL checks costs:

parallel_setup_cost to avoid parallel execution for short queries. It models the time spent for memory setup, process start, and initial communication

parallel_tuple_cost : The communication between leader and workers could take a long time. The time is proportional to the number of tuples sent by workers. The parameter models the communication cost.

Nested loop joins

PostgreSQL 9.6+ could execute a “Nested loop” in parallel due to the simplicity of the operation.

explain (costs off) select c_custkey, count(o_orderkey)
                from    customer left outer join orders on
                                c_custkey = o_custkey and o_comment not like '%special%deposits%'
                group by c_custkey;
                                      QUERY PLAN
--------------------------------------------------------------------------------------
 Finalize GroupAggregate
   Group Key: customer.c_custkey
   ->  Gather Merge
         Workers Planned: 4
         ->  Partial GroupAggregate
               Group Key: customer.c_custkey
               ->  Nested Loop Left Join
                     ->  Parallel Index Only Scan using customer_pkey on customer
                     ->  Index Scan using idx_orders_custkey on orders
                           Index Cond: (customer.c_custkey = o_custkey)
                           Filter: ((o_comment)::text !~~ '%special%deposits%'::text)

Gather happens in the last stage, so “Nested Loop Left Join” is a parallel operation. “Parallel Index Only Scan” is available from version 10. It acts in a similar way to a parallel sequential scan. The

c_custkey = o_custkey

condition reads a single order for each customer row. Thus it’s not parallel.

Hash Join

Each worker builds its own hash table until PostgreSQL 11. As a result, 4+ workers weren’t able to improve performance. The new implementation uses a shared hash table. Each worker can utilize WORK_MEM to build the hash table.

select
        l_shipmode,
        sum(case
                when o_orderpriority = '1-URGENT'
                        or o_orderpriority = '2-HIGH'
                        then 1
                else 0
        end) as high_line_count,
        sum(case
                when o_orderpriority <> '1-URGENT'
                        and o_orderpriority <> '2-HIGH'
                        then 1
                else 0
        end) as low_line_count
from
        orders,
        lineitem
where
        o_orderkey = l_orderkey
        and l_shipmode in ('MAIL', 'AIR')
        and l_commitdate < l_receiptdate
        and l_shipdate < l_commitdate
        and l_receiptdate >= date '1996-01-01'
        and l_receiptdate < date '1996-01-01' + interval '1' year
group by
        l_shipmode
order by
        l_shipmode
LIMIT 1;
                                                                                                                                    QUERY PLAN
-----------------------------------------------------------------------------------------------------------------------------------------------------------------------------------------------------------------------------------------------------------------------------------
 Limit  (cost=1964755.66..1964961.44 rows=1 width=27) (actual time=7579.592..7922.997 rows=1 loops=1)
   ->  Finalize GroupAggregate  (cost=1964755.66..1966196.11 rows=7 width=27) (actual time=7579.590..7579.591 rows=1 loops=1)
         Group Key: lineitem.l_shipmode
         ->  Gather Merge  (cost=1964755.66..1966195.83 rows=28 width=27) (actual time=7559.593..7922.319 rows=6 loops=1)
               Workers Planned: 4
               Workers Launched: 4
               ->  Partial GroupAggregate  (cost=1963755.61..1965192.44 rows=7 width=27) (actual time=7548.103..7564.592 rows=2 loops=5)
                     Group Key: lineitem.l_shipmode
                     ->  Sort  (cost=1963755.61..1963935.20 rows=71838 width=27) (actual time=7530.280..7539.688 rows=62519 loops=5)
                           Sort Key: lineitem.l_shipmode
                           Sort Method: external merge  Disk: 2304kB
                           Worker 0:  Sort Method: external merge  Disk: 2064kB
                           Worker 1:  Sort Method: external merge  Disk: 2384kB
                           Worker 2:  Sort Method: external merge  Disk: 2264kB
                           Worker 3:  Sort Method: external merge  Disk: 2336kB
                           ->  Parallel Hash Join  (cost=382571.01..1957960.99 rows=71838 width=27) (actual time=7036.917..7499.692 rows=62519 loops=5)
                                 Hash Cond: (lineitem.l_orderkey = orders.o_orderkey)
                                 ->  Parallel Seq Scan on lineitem  (cost=0.00..1552386.40 rows=71838 width=19) (actual time=0.583..4901.063 rows=62519 loops=5)
                                       Filter: ((l_shipmode = ANY ('{MAIL,AIR}'::bpchar[])) AND (l_commitdate < l_receiptdate) AND (l_shipdate < l_commitdate) AND (l_receiptdate >= '1996-01-01'::date) AND (l_receiptdate < '1997-01-01 00:00:00'::timestamp without time zone))
                                       Rows Removed by Filter: 11934691
                                 ->  Parallel Hash  (cost=313722.45..313722.45 rows=3750045 width=20) (actual time=2011.518..2011.518 rows=3000000 loops=5)
                                       Buckets: 65536  Batches: 256  Memory Usage: 3840kB
                                       ->  Parallel Seq Scan on orders  (cost=0.00..313722.45 rows=3750045 width=20) (actual time=0.029..995.948 rows=3000000 loops=5)
 Planning Time: 0.977 ms
 Execution Time: 7923.770 ms

Query 12 from TPC-H is a good illustration for a parallel hash join. Each worker helps to build a shared hash table.

Merge Join

Due to the nature of merge join it’s not possible to make it parallel. Don’t worry if it’s the last stage of the query execution—you can still can see parallel execution for queries with a merge join.

-- Query 2 from TPC-H
explain (costs off) select s_acctbal, s_name, n_name, p_partkey, p_mfgr, s_address, s_phone, s_comment
from    part, supplier, partsupp, nation, region
where
        p_partkey = ps_partkey
        and s_suppkey = ps_suppkey
        and p_size = 36
        and p_type like '%BRASS'
        and s_nationkey = n_nationkey
        and n_regionkey = r_regionkey
        and r_name = 'AMERICA'
        and ps_supplycost = (
                select
                        min(ps_supplycost)
                from    partsupp, supplier, nation, region
                where
                        p_partkey = ps_partkey
                        and s_suppkey = ps_suppkey
                        and s_nationkey = n_nationkey
                        and n_regionkey = r_regionkey
                        and r_name = 'AMERICA'
        )
order by s_acctbal desc, n_name, s_name, p_partkey
LIMIT 100;
                                                QUERY PLAN
----------------------------------------------------------------------------------------------------------
 Limit
   -&gt;  Sort
         Sort Key: supplier.s_acctbal DESC, nation.n_name, supplier.s_name, part.p_partkey
         -&gt;  Merge Join
               Merge Cond: (part.p_partkey = partsupp.ps_partkey)
               Join Filter: (partsupp.ps_supplycost = (SubPlan 1))
               -&gt;  Gather Merge
                     Workers Planned: 4
                     -&gt;  Parallel Index Scan using <strong>part_pkey</strong> on part
                           Filter: (((p_type)::text ~~ '%BRASS'::text) AND (p_size = 36))
               -&gt;  Materialize
                     -&gt;  Sort
                           Sort Key: partsupp.ps_partkey
                           -&gt;  Nested Loop
                                 -&gt;  Nested Loop
                                       Join Filter: (nation.n_regionkey = region.r_regionkey)
                                       -&gt;  Seq Scan on region
                                             Filter: (r_name = 'AMERICA'::bpchar)
                                       -&gt;  Hash Join
                                             Hash Cond: (supplier.s_nationkey = nation.n_nationkey)
                                             -&gt;  Seq Scan on supplier
                                             -&gt;  Hash
                                                   -&gt;  Seq Scan on nation
                                 -&gt;  Index Scan using idx_partsupp_suppkey on partsupp
                                       Index Cond: (ps_suppkey = supplier.s_suppkey)
               SubPlan 1
                 -&gt;  Aggregate
                       -&gt;  Nested Loop
                             Join Filter: (nation_1.n_regionkey = region_1.r_regionkey)
                             -&gt;  Seq Scan on region region_1
                                   Filter: (r_name = 'AMERICA'::bpchar)
                             -&gt;  Nested Loop
                                   -&gt;  Nested Loop
                                         -&gt;  Index Scan using idx_partsupp_partkey on partsupp partsupp_1
                                               Index Cond: (part.p_partkey = ps_partkey)
                                         -&gt;  Index Scan using supplier_pkey on supplier supplier_1
                                               Index Cond: (s_suppkey = partsupp_1.ps_suppkey)
                                   -&gt;  Index Scan using nation_pkey on nation nation_1
                                         Index Cond: (n_nationkey = supplier_1.s_nationkey)

The “Merge Join” node is above “Gather Merge”. Thus merge is not using parallel execution. But the “Parallel Index Scan” node still helps with the part_pkey segment.

Partition-wise join

PostgreSQL 11 disables the partition-wise join feature by default. Partition-wise join has a high planning cost. Joins for similarly partitioned tables could be done partition-by-partition. This allows postgres to use smaller hash tables. Each per-partition join operation could be executed in parallel.

tpch=# set enable_partitionwise_join=t;
tpch=# explain (costs off) select * from prt1 t1, prt2 t2
where t1.a = t2.b and t1.b = 0 and t2.b between 0 and 10000;
                    QUERY PLAN
---------------------------------------------------
 Append
   ->  Hash Join
         Hash Cond: (t2.b = t1.a)
         ->  Seq Scan on prt2_p1 t2
               Filter: ((b >= 0) AND (b <= 10000))
         ->  Hash
               ->  Seq Scan on prt1_p1 t1
                     Filter: (b = 0)
   ->  Hash Join
         Hash Cond: (t2_1.b = t1_1.a)
         ->  Seq Scan on prt2_p2 t2_1
               Filter: ((b >= 0) AND (b <= 10000))
         ->  Hash
               ->  Seq Scan on prt1_p2 t1_1
                     Filter: (b = 0)
tpch=# set parallel_setup_cost = 1;
tpch=# set parallel_tuple_cost = 0.01;
tpch=# explain (costs off) select * from prt1 t1, prt2 t2
where t1.a = t2.b and t1.b = 0 and t2.b between 0 and 10000;
                        QUERY PLAN
-----------------------------------------------------------
 Gather
   Workers Planned: 4
   ->  Parallel Append
         ->  Parallel Hash Join
               Hash Cond: (t2_1.b = t1_1.a)
               ->  Parallel Seq Scan on prt2_p2 t2_1
                     Filter: ((b >= 0) AND (b <= 10000))
               ->  Parallel Hash
                     ->  Parallel Seq Scan on prt1_p2 t1_1
                           Filter: (b = 0)
         ->  Parallel Hash Join
               Hash Cond: (t2.b = t1.a)
               ->  Parallel Seq Scan on prt2_p1 t2
                     Filter: ((b >= 0) AND (b <= 10000))
               ->  Parallel Hash
                     ->  Parallel Seq Scan on prt1_p1 t1
                           Filter: (b = 0)

Above all, a partition-wise join can use parallel execution only if partitions are big enough.

Parallel Append

Parallel Append partitions work instead of using different blocks in different workers. Usually, you can see this with UNION ALL queries. The drawback – less parallelism, because every worker could ultimately work for a single query.

There are just two workers launched even with four workers enabled.

tpch=# explain (costs off) select sum(l_quantity) as sum_qty from lineitem where l_shipdate <= date '1998-12-01' - interval '105' day union all select sum(l_quantity) as sum_qty from lineitem where l_shipdate <= date '2000-12-01' - interval '105' day;
                                           QUERY PLAN
------------------------------------------------------------------------------------------------
 Gather
   Workers Planned: 2
   ->  Parallel Append
         ->  Aggregate
               ->  Seq Scan on lineitem
                     Filter: (l_shipdate <= '2000-08-18 00:00:00'::timestamp without time zone)
         ->  Aggregate
               ->  Seq Scan on lineitem lineitem_1
                     Filter: (l_shipdate <= '1998-08-18 00:00:00'::timestamp without time zone)

Most important variables

  • WORK_MEM limits the memory usage of each process! Not just for queries: work_mem * processes * joins => could lead to significant memory usage.
  • max_parallel_workers_per_gather  – how many workers an executor will use for the parallel execution of a planner node
  • max_worker_processes – adapt the total number of workers to the number of CPU cores installed on a server
  • max_parallel_workers – same for the number of parallel workers

Summary

Starting from 9.6 parallel queries execution could significantly improve performance for complex queries scanning many rows or index records. In PostgreSQL 10, parallel execution was enabled by default. Do not forget to disable parallel execution on servers with a heavy OLTP workload. Sequential scans or index scans still consume a significant amount of resources. If you are not running a report against the whole dataset, you may improve query performance just by adding missing indexes or by using proper partitioning.

References


Image compiled from photos by Nathan Gonthier and Pavel Nekoranec on Unsplash

PostgreSQL fsync Failure Fixed – Minor Versions Released Feb 14, 2019

fsync postgresql upgrade

PostgreSQL logoIn case you didn’t already see this news, PostgreSQL has got its first minor version released for 2019. This includes minor version updates for all supported PostgreSQL versions. We have indicated in our previous blog post that PostgreSQL 9.3 had gone EOL, and it would not support any more updates. This release includes the following PostgreSQL major versions:

What’s new in this release?

One of the common fixes applied to all the supported PostgreSQL versions is on – panic instead of retrying after fsync () failure. This fsync failure has been in discussion for a year or two now, so let’s take a look at the implications.

A fix to the Linux fsync issue for PostgreSQL Buffered IO in all supported versions

PostgreSQL performs two types of IO. Direct IO – though almost never – and the much more commonly performed Buffered IO.

PostgreSQL uses O_DIRECT when it is writing to WALs (Write-Ahead Logs aka Transaction Logs) only when

wal_sync_method

 is set to :

open_datasync

 or to 

open_sync

 with no archiving or streaming enabled. The default 

wal_sync_method

 may be

fdatasync

 that does not use O_DIRECT. This means, almost all the time in your production database server, you’ll see PostgreSQL using O_SYNC / O_DSYNC while writing to WAL’s. Whereas, writing the modified/dirty buffers to datafiles from shared buffers is always through Buffered IO.  Let’s understand this further.

Upon checkpoint, dirty buffers in shared buffers are written to the page cache managed by kernel. Through an fsync(), these modified blocks are applied to disk. If an fsync() call is successful, all dirty pages from the corresponding file are guaranteed to be persisted on the disk. When there is an fsync to flush the pages to disk, PostgreSQL cannot guarantee a copy of a modified/dirty page. The reason is that writes to storage from the page cache are completely managed by the kernel, and not by PostgreSQL.

This could still be fine if the next fsync retries flushing of the dirty page. But, in reality, the data is discarded from the page cache upon an error with fsync. And the next fsync would obviously succeed ignoring the previous errors, because it now includes the next set of dirty buffers that need to be written to disk and not the ones that failed earlier.

To understand it better, consider an example of Linux trying to write dirty pages from page cache to a USB stick that was removed during an fsync. Neither the ext4 file system nor the btrfs nor an xfs tries to retry the failed writes. A silently failing fsync may result in data loss, block corruption, table or index out of sync, foreign key or other data integrity issues… and deleted records may reappear.

Until a while ago, when we used local storage or storage using RAID Controllers with write cache, it might not have been a big problem. This issue goes back to the time when PostgreSQL was designed for buffered IO but not Direct IO. Should this now be considered an issue with PostgreSQL and the way it’s designed? Well, not exactly.

All this started with the error handling during a writeback in Linux. A writeback asynchronously performs dirty page writes from page cache to filesystem. In ext4 like filesystems, upon a writeback error, the page is marked clean and up to date, and the user space is unaware of the problem.

fsync errors are now detected

Starting from kernel 4.13, we can now reliably detect such errors during fsync. So, any open file descriptor to a file includes a pointer to the address_space structure, and a new 32-bit value (errseq_t) has been added that is visible to all the processes accessing that file. With the new minor version for all supported PostgreSQL versions, a PANIC is triggered upon such error. This performs a database crash and initiates recovery from the last CHECKPOINT. There is a patch expected to be released in PostgreSQL 12 that works for newer kernel versions and modifies the way PostgreSQL handles the file descriptors. A long term solution to this issue may be Direct IO, but you might see a different approach to this in PG 12.

A good amount of work on this issue was done by Jeff Layton on reporting writeback errors, and Matthew Wilcox. What this patch means is that a writeback error gets reported during an fsync, which can be seen by another process that opens that file. A new 32-bit value that stores an error code and a sequence number are added to a new

typedef: errseq_t

 . So, these errors are now in the

address_space

 . But, if the struct inode is gone due to a memory pressure, this patch has no value.

Can i enable or disable the PANIC on fsync failure in PostgreSQL newer releases ?

Yes. You can set this parameter :

data_sync_retry

 to false (default), where a PANIC-level error is raised to recover from WAL through a database crash. You must be sure to have a proper high-availability mechanism so that the impact is minimal for your application. You could let your application failover to a slave, which could minimize the impact.

You can always set

data_sync_retry

 to true, if you are sure about how your OS behaves during write-back failures. By setting this to true, PostgreSQL will just report an error and continue to run.

Some of the other possible issues now fixed and common to these minor releases

  1. A lot of features and fixes related to PARTITIONING have been applied in this minor release. (PostgreSQL 10 and 11 only).
  2. Autovacuum has been made more aggressive about removing leftover temporary tables.
  3. Deadlock when acquiring multiple buffer locks.
  4. Crashes in logical replication.
  5. Incorrect planning of queries in which a lateral reference must be evaluated at a foreign table scan.
  6. Fixed some issues reported with ANALYZE and TRUNCATE operations.
  7. Fix to contrib/hstore to calculate correct hash values for empty hstore values that were created in version 8.4 or before.
  8. A fix to pg_dump’s handling of materialized views with indirect dependencies on primary keys.

We always recommend that you keep your PostgreSQL databases updated to the latest minor versions. Applying a minor release might need a restart after updating the new binaries.

Here is the sequence of steps you should follow to upgrade to the latest minor versions after thorough testing :

  1. Shutdown the PostgreSQL database server
  2. Install the updated binaries
  3. Restart your PostgreSQL database server

Most of the time, you can choose to update the minor versions in a rolling fashion in a master-slave (replication) setup because it avoids downtime for both reads and writes simultaneously. For a rolling style update, you could perform the update on one server after another… but not all at once. However, the best method that we’d almost always recommend is – shutdown, update and restart all instances at once.

If you are currently running your databases on PostgreSQL 9.3.x or earlier, we recommend that you to prepare a plan to upgrade your PostgreSQL databases to the supported versions ASAP. Please subscribe to our blog posts so that you can hear about the various options for upgrading your PostgreSQL databases to a supported major version.


Photo by Andrew Rice on Unsplash

PostgreSQL Webinar Wed April 17 – Upgrading or Migrating Your Legacy PostgreSQL to Newer PostgreSQL Versions

upgrade postgresql webinar series

PostgreSQL logoA date for your diary. On Wednesday, April 17 at 7:00 AM PDT (UTC-7) / 10:00 AM EDT (UTC-4) Percona’s PostgreSQL Support Technical Lead, Avinash Vallarapu and Senior Support Engineers, Fernando Laudares, Jobin Augustine and Nickolay Ihalainen, will demonstrate the upgrade of a legacy version of PostgreSQL to a newer version, using built-in as well as open source tools. In the lead up to the live webinar, we’ll be publishing a series of five blog posts that will help you to understand the solutions available to perform a PostgreSQL upgrade.

Register Now

Synopsis

Are you stuck with an application that is using an older version PostgreSQL which is no longer supported? Are you looking for the methods available to upgrade a legacy version PostgreSQL cluster (< PostgreSQL 9.3)? Are you searching for solutions that could upgrade your PostgreSQL with a minimalistic downtime? Are you afraid that your application may not work with latest PostgreSQL versions as it was built on a legacy version, a few years ago? Do you want to confirm if you are doing your PostgreSQL upgrades the right way ? Do you think that you need to buy an enterprise license to minimize the downtime involved in upgrades?

Then we suggest you to subscribe to our webinar, that should answer most of your questions around PostgreSQL upgrades.

This webinar starts with a list of solutions that are built-in to PostgreSQL to help us upgrade a legacy version of PostgreSQL with minimal downtime. The advantages of choosing such methods will also be discussed. You’ll notice a list of prerequisites for each solution, reducing the scope of possible mistakes. It’s important to minimize downtime when upgrading from an older version of PostgreSQL server. Therefore, we will present three open source solutions that will help us either to minimize or to completely avoid downtime.

Our presentation will show the full process of upgrading a set of PostgreSQL servers to the latest available version. Furthermore, we’ll show the pros and cons for each of the methods we employed.

The webinar programme

Topics covered in this webinar will include:

  1. PostgreSQL upgrade using pg_dump/pg_restore (with downtime)
  2. PostgreSQL upgrade using pg_dumpall (with downtime)
  3. Continuous replication from a legacy PostgreSQL version to a newer version using Slony.
  4. Replication between major PostgreSQL versions using Logical Replication.
  5. Fast upgrade of legacy PostgreSQL with minimum downtime.

In the 45 minute session, we’ll walk you through the methods and demonstrate some of the methods you may find useful in your database environment. We’ll see how simple and quick it is to perform the upgrade using our approach.

Register Now


Image adapted from Photo by Magda Ehlers from Pexels

Settling the Myth of Transparent HugePages for Databases

The concept of Linux HugePages has existed for quite a while: for more than 10 years, introduced to Debian in 2007 with kernel version 2.6.23. Whilst a smaller page size is useful for general use, some memory intensive applications may gain performance by using bigger memory pages. By having bigger memory chunks available to them, they can reduce lookup time as well as improve the performance of read/write operations. To be able to make use of HugePages, applications need to carry the specific code directive, and changing applications across the board is not necessarily a simple task. So enter Transparent HugePages (THP).

By reputation, THPs are said to have a negative impact on performance. For this post, I set out to either prove or debunk the case for the use of THPs for database applications.

The Linux context

On Linux – and for that matter all operating systems that I know of – memory is divided into small chunks called pages. A typical memory page size is set to 4k. You can obtain the value of page size on Linux using getconf.

# getconf PAGE_SIZE
4096

Generally, the latest processors support multiple page sizes. However, Linux defaults to a minimal 4k page size. For a system with 64GB physical memory, this memory will be divided into more than 16 million pages. Linking between these pages and physical memory (which is called page table walking) is undertaken by the CPU’s memory management unit (MMU). To optimize page lookup, CPU maintains a cache of recently used pages called the Table Lookaside Buffer (TLB). The higher the number of pages, the lower the percentage of pages that are maintained in TLB. This translates to a higher cache miss ratio. With every cache miss, a more expensive search must be done via page table walking. In effect, that leads to a degradation in performance.

So what if we could increase the page size? We could then reduce the number of pages accessed, and reduce the cost of page walking. Cache hit ratio might then improve because more relevant data now fits in one page rather than multiple pages.

The Linux kernel will always try to allocate a HugePage (if enabled) and will fall back to the default 4K if a contiguous chunk of the required memory size is not available in the required memory space.

The implication for applications

As mentioned, for an application to make use of HugePages it has to contain an explicit instruction to do so. It’s not always practical to change applications in this way so there’s another option.

Transparent HugePages provides a layer within the Linux kernel – probably since version 2.6.38 – which if enabled can potentially allocate HugePages for applications without them actually “knowing” it; hence the transparency. The expectation is that this will improve application performance.

In this blog, I’ll attempt to find the reasons why THP might help improve database performance. There’s a lot of discussion amongst database experts that classic HugePages give a performance gain, but you’ll see a performance hit with Transparent HugePages. I decided to take up the challenge and perform various benchmarks, with different settings, and with different workloads.

So do Transparent HugePages (THP) improve application performance? More specifically, do they improve performance for database workloads? Most industry standard databases recommend disabling THP and enabling HugePages alone.

So is this a myth or does THP degrade performance for databases? Time to break this myth.

Enabling THP

The current setting can be seen using the command line

# cat /sys/kernel/mm/transparent_hugepage/enabled
[always] madvise never

Temporary Change

It can be enabled or disabled using the command line.

# echo never > /sys/kernel/mm/transparent_hugepage/enabled

Permanent Change via grub

Or by setting grub parameter  in 

/etc/default/grub

 . 

You can choose one of the three configurations for THP; enable, disable, or “madvise”. Whilst enable and disable options are self-explanatory, madvise allows applications that are optimized for HugePages to use THP.  Applications can use Transparent HugePages by making the madvise system call.

Why was the madvise option added? We will discuss that in a later section.

Transparent HugePages problems

The khugepaged CPU usage

The allocation of a HugePage can be tricky. Whilst traditional HugePages are reserved in virtual memory, THPs are not. In the background, the kernel attempts to allocate a THP, and if it fails, will default to the standard 4k page. This all happens transparently to the user.

The allocation process can potentially involve a number of kernel processes which may include kswapd, defrag, and kcompactd. All of these are responsible for making space in the virtual memory for a future THP. When required, the allocation is made by another kernel process; khugepaged. This process manages Transparent HugePages.

Spikes

It depends on how khugepaged is configured, but since no memory is reserved beforehand, there is potential for performance degradation. With every attempt to allocate a HugePage, potentially a number of kernel processes are invoked. These carry out certain actions to make enough room in the virtual memory for a THP allocation. Although no notifications are provided to the application, precious resources are spent, and this can lead to spikes in performance with any dips indicating an attempt to allocate THP.

Memory Bloating

HugePages are for not for every application. For example, an application that wants to allocate only one byte of data would be better off using a 4k page rather than a huge one. That way, memory is more efficiently used. To prevent this, one option is to configure THP to “madvise”. By doing this, HugePages are disabled system-wide but are available to applications that make a madvise call to allocate THP in the madvise memory region.

Swapping

Linux kernel keeps track of memory pages and differentiates between pages are that are actively being used and the ones that are not immediately required. It may load or unload a page from active memory to disk if that page is no longer required or vice versa.

When page size is 4k, these memory operations are understandably fast. However, consider a 1GB page size: there will a significant performance hit when such a page is swapped out. When a THP is swapped out, it is split in standard page sizes. Unlike conventional HugePages which are reserved in RAM and are never swapped, THPs are swappable pages. They could, therefore, potentially be swapped causing a dip in performance. Although in recent years, there have been loads of performance improvements around swapping out the THPs process, it still does impact performance negatively.

Benchmark

I decided to benchmark with and without Transparent HugePages enabled. Initially, I used pgbench – a PostgreSQL benchmarking tool based on TPCB – for a duration of ten minutes. The benchmark used a mixed mode of READ/WRITE. The results with and without the Transparent HugePages show no degradation or improvement in the benchmark. To be sure, I repeated the same benchmark for 60 minutes and got almost the same results.  I performed another benchmark with a TPCC workload using the sysbench benchmarking tool. The results are almost the same.

Benchmark Machine

  • Supermicro server:
    • Intel(R) Xeon(R) CPU E5-2683 v3 @ 2.00GHz
    • 2 sockets / 28 cores / 56 threads
    • Memory: 256GB of RAM
    • Storage: SAMSUNG  SM863 1.9TB Enterprise SSD
    • Filesystem: ext4/xfs
  • OS: Linux smblade01 4.15.0-42-generic #45~16.04.1-Ubuntu
  • PostgreSQL: version 11

Benchmark TPCB (pgbench) – 10 Minute duration

The following graphs show results for two different database sizes; 48GB and 112GB with 64, 128 and 256 clients each. All other settings were kept unchanged for these benchmarks to ensure that our results are comparable. It is evident that both lines — representing execution with or without THP — are almost overlapping one another. This suggests no performance gains.

Figure 1.1 PostgreSQL' s Benchmark, 10 minutes execution time where database workload(48GB) < shared_buffer (64GB)

Figure 1.1 PostgreSQL’ s Benchmark, 10 minutes execution time where database workload(48GB) < shared_buffer (64GB)


Figure 1.2 PostgreSQL' s Benchmark, 10 minutes execution time where database workload (48GB) > shared_buffer (64GB)

Figure 1.2 PostgreSQL’ s Benchmark, 10 minutes execution time where database workload (48GB) > shared_buffer (64GB)


Figure 1.3 PostgreSQL' s Benchmark, 10 minutes execution time where database workload (48GB) < shared_buffer (64GB)

Figure 1.3 PostgreSQL’ s Benchmark, 10 minutes execution time where database workload (48GB) < shared_buffer (64GB) -dTLB-misses


Figure 1.4 PostgreSQL' s Benchmark, 10 minutes execution time where database workload (112GB) > shared_buffer (64GB)

Figure 1.4 PostgreSQL’ s Benchmark, 10 minutes execution time where database workload (112GB) > shared_buffer (64GB)-dTLB-misses


Benchmark TPCB (pgbench) – 60 Minute duration

Figure 2.1 PostgreSQL' s Benchmark, 60 minutes execution time where database workload (48GB) < shared_buffer (64GB)

Figure 2.1 PostgreSQL’ s Benchmark, 60 minutes execution time where database workload (48GB) < shared_buffer (64GB)


Figure 2.2 PostgreSQL' s Benchmark, 60 minutes execution time where database workload (112GB) &gt; shared_buffer (64GB)

Figure 2.2 PostgreSQL’ s Benchmark, 60 minutes execution time where database workload (112GB) > shared_buffer (64GB)


Figure 2.3 PostgreSQL' s Benchmark, 60 minutes execution time where database workload (48GB) < shared_buffer (64GB)

Figure 2.3 PostgreSQL’ s Benchmark, 60 minutes execution time where database workload (48GB) < shared_buffer (64GB) -dTLB-misses


Figure 2.4 PostgreSQL' s Benchmark, 60 minutes execution time where database workload (112GB) > shared_buffer (64GB)

Figure 2.4 PostgreSQL’ s Benchmark, 60 minutes execution time where database workload (112GB) > shared_buffer (64GB) -dTLB-misses


Benchmark TPCC (sysbecnch) – 10 Minute duration

Figure 3.1 PostgreSQL' s Benchmark, 10 minutes execution time where database workload (48GB) &lt; shared_buffer (64GB)

Figure 3.1 PostgreSQL’ s Benchmark, 10 minutes execution time where database workload (48GB) < shared_buffer (64GB)

Figure 3.2 PostgreSQL' s Benchmark, 10 minutes execution time where database workload (112GB) &gt; shared_buffer (64GB)

Figure 3.2 PostgreSQL’ s Benchmark, 10 minutes execution time where database workload (112GB) > shared_buffer (64GB)


Figure 3.3 PostgreSQL' s Benchmark, 10 minutes execution time where database workload (48GB) < shared_buffer (64GB)

Figure 3.3 PostgreSQL’ s Benchmark, 10 minutes execution time where database workload (48GB) < shared_buffer (64GB) -dTLB-misses


Figure 3.4 PostgreSQL' s Benchmark, 10 minutes execution time where database workload 112GB) > shared_buffer (64GB)

Figure 3.4 PostgreSQL’ s Benchmark, 10 minutes execution time where database workload 112GB) > shared_buffer (64GB) -dTLB-misses


Conclusion

I attained these results by running different benchmarking tools and evaluating different OLTP benchmarking standards. The results clearly indicate that for these workloads, THP has a negative impact on the overall database performance. Although the performance degradation is negligible, it is, however, clear that there is no performance gain as one might expect. This is very much in line with all the different databases’ recommendation which suggests disabling the THP.

THP may be beneficial for various applications, but it certainly doesn’t give any performance gains when handling an OLTP workload.

We can safely say that the “myth” is derived from experience and that the rumors are true.

Summary

  • The complete benchmark data is available at GitHub[1]
  • The complete “nmon” reports, which include CPU, memory etc usage can be found at GitHub[2]
  • This whole benchmark is based around OLTP. Watch out for the OLAP benchmark. Maybe THP will have more effect on this type of workload.

[1] – https://github.com/Percona-Lab-results/THP-POSTGRESQL-2019/blob/master/results.xlsx

[2] – https://github.com/Percona-Lab-results/THP-POSTGRESQL-2019/tree/master/results


Does Percona Monitoring and Management (PMM) Support External Monitoring Services? Yes It Does!

External Monitoring Services

Percona Monitoring and Management (PMM) is a free and open-source platform for managing and monitoring MySQL and MongoDB performance. You can run PMM in your own environment for maximum security and reliability. It provides thorough time-based analysis for MySQL and MongoDB servers to ensure that your data works as efficiently as possible.

Starting with version 1.4.0 and improved in 1.7.0, PMM supports external monitoring services. This means you can plug in Prometheus exporters for technologies not directly provided by Percona. For example, you can start monitoring the metrics of your PostgreSQL database host, Memcached or Redis.

Exporters Overview

Applications store their metrics in arbitrary formats, and Prometheus exporters collect them and produce (or export to) a consistent format of key-value pairs. The keys refer to metric types and values are numbers in the float 64 format. Due to the diversity of formats that applications may use, you should program a specific exporter for each format. However, if you decide to make the metrics of your application available via PMM you may consider using one of existing Prometheus exporters.

Currently, PMM offers exporters for MySQL (mysqld_exporter) and MongoDB (mongodb_exporter) database management systems. Built-in exporters also exist for Percona XtraDBCluster, MariaDB, RDS and Aurora via mysqld_exporter and for ProxySQL (via proxysql_exporter). These exporters are made available as monitoring services that you can add or remove as necessary. In addition, PMM includes the node_exporter to capture the host level Linux metrics such as CPU, Load, and disk resources.

Using Exporters

On the computer where the PMM client is installed and connected to a PMM server, make use of the pmm-admin utility to add any built-in monitoring service directly. There is no extra effort in this case: the added monitoring service will run its exporter and all required configuration updates are made automatically to make the metrics available in the web interface for further analysis in Query analytics and Metrics monitor.

In case of external monitoring services, you need to locate, download, set up and run the specific Prometheus exporter to collect metrics. When it is ready, you can add it as a monitoring service:

pmm-admin add external:service job_name [instance] --service-port=PORT_NUMBER

This command adds an external monitoring service bound to the Prometheus job that you specify as the job_name parameter. You should also provide the port associated with this Prometheus job as the value of the service-port parameter. The instance parameter is optional. By default, it is assigned the name of the host where you run pmm-admin.

Example 1: Adding a PostgreSQL Monitoring Service

In order to add an external monitoring service for a PostgreSQL database server, make sure to install and configure your PostgreSQL server. Then, select a PostgreSQL Prometheus exporter from the list available from the  Prometheus site, such as PostgreSQL metric exporter for Prometheus. Refer to the documentation for this exporter for details about how to install and set it up.

As soon as your Prometheus exporter can collect metrics from your PostgreSQL database server,  you are ready to add this exporter as a monitoring service. Make sure that you have access to a configured PMM server and your PMM client has been set up to use it. Use the pmm-admin utility, which is part of PMM client, to add the PostgreSQL monitoring service. Assuming postgresql is the name of this monitoring service, your command should look like this:

pmm-admin add external:service --service-port=PORT_NUMBER postgresql

It is time now to display the metrics on the PMM Server. Open Metrics Monitor and check the Advanced Data Exploration dashboard. This can dashboard visualize a lot of metrics including those exposed by external monitoring services. In the Host field select your host. Use the Metric field to select a metric.

External Monitoring Services
Viewing a metric exposed by a PostgreSQL exporter.

Setting up an external monitoring service requires extra work compared to adding built-in monitoring services. However, by using external monitoring services you can considerably extend the capabilities of your PMM installation.

Note that running the pmm-admin list command lists the added external monitoring services. They also appear in the JSON output, too. To remove an external service use the remove (or its short form rm) command:

pmm-admin rm external:service --service-port=PORT_NUMBER NAME_OF_EXTERNAL_MONITORING_SERVICE

$ sudo pmm-admin list
pmm-admin 1.7.0
PMM Server      | 192.0.2.2 (password-protected)
Client Name     | postgres01
Client Address  | 192.0.2.3
Service Manager | unix-systemv
Job name    Scrape interval  Scrape timeout  Metrics path  Scheme  Target         Labels                   Health
postgresql  1s               1s              /metrics      http    192.0.2.3:9187 instance="postgres01"      UP

Example 2: Adding a Redis Monitoring Service

To start with, you must install a Prometheus exporter for Redis (this exporter is listed on the Prometheus Exporters and Integrations page) on the machine where your PMM client runs. The following command adds this exporter as an external monitoring service (run it as a superuser or use sudo). This time the command has an extra parameter:

$ sudo pmm-admin add external:service redis --service-port 9121 redis01
External service added.

Notice that we use Redis Server as the last parameter passed to pmm-admin add external:service command. The last positional parameter is a label that you assign to this particular instance.

pmm-admin add external:service --service-port=PORT_NUMBER NAME_OF_EXTERNAL_MONITORING_SERVICE [INSTANCE_LABEL]

You may choose any name for this purpose. Make sure to use quotes if you decide to use a label made of two or more words.

$ sudo pmm-admin list
pmm-admin 1.7.0
PMM Server | 127.0.0.1
Client Name | percona
Client Address | 172.17.0.1
Service Manager | linux-systemd
No services under monitoring.
Job name Scrape interval Scrape timeout Metrics path Scheme Target          Labels                  Health
redis    1m0s            10s            /metrics     http   172.17.0.1:9121 instance="redis01"      UP

To view Redis related metrics you need to open the Advanced Data Exploration dashboard on your PMM Server. The redis01 label automatically appears in the Host field in the Advanced Data Exploration dashboard. In the Host field, select the redis01 option and choose a metric to view from the Metric field, such as redis_exporter_scrapes_total.

Other Ways to Add External Services

The pmm-admin add external:service command is the recommended way to add an external monitoring service. There exist other, more specific, methods. The pmm-admin add external:metrics adds external Prometheus exporters job to metrics monitoring.

This Week in Data with Colin Charles 28: Percona Live, MongoDB Transactions and Spectre/Meltdown Rumble On

Colin Charles

Colin CharlesJoin Percona Chief Evangelist Colin Charles as he covers happenings, gives pointers and provides musings on the open source database community.

In case you missed last week’s column, don’t forget to read the fairly lengthy FOSDEM MySQL & Friends DevRoom summary.

From a Percona Live Santa Clara 2018 standpoint, beyond the tutorials getting picked and scheduled, the talks have also been picked and scheduled (so you were very likely getting acceptance emails from the Hubb.me system by Tuesday). The rejections have not gone out yet but will follow soon. I expect the schedule to go live either today (end of week) or early next week. Cheapest tickets end March 4, so don’t wait to register!

Amazon Relational Database Service has had a lot of improvements in 2017, and the excellent summary from Jeff Barr is worth a read: Amazon Relational Database Service – Looking Back at 2017. Plenty of improvements for the MySQL, MariaDB Server, PostgreSQL and Aurora worlds.

Spectre/Meltdown and its impact are still being discovered. You need to read Brendan Gregg’s amazing post: KPTI/KAISER Meltdown Initial Performance Regressions. And if you visit Percona Live, you’ll see an amazing keynote from him too! Are you still using MyISAM? MyISAM and KPTI – Performance Implications From The Meltdown Fix suggests switching to Aria or InnoDB.

Probably the biggest news this week though? Transactions are coming to MongoDB 4.0. From the site, “MongoDB 4.0 will add support for multi-document transactions, making it the only database to combine the speed, flexibility, and power of the document model with ACID guarantees. Through snapshot isolation, transactions will provide a globally consistent view of data, and enforce all-or-nothing execution to maintain data integrity.”. You want to read the blog post, MongoDB Drops ACID (the title works if you’re an English native speaker, but maybe not quite if you aren’t). The summary diagram was a highlight for me because you can see the building blocks, plus future plans for MongoDB 4.2.

Releases

Link List

Upcoming appearances

  • SCALE16x – Pasadena, California, USA – March 8-11 2018
  • FOSSASIA 2018 – Singapore – March 22-25 2018

Feedback

I look forward to feedback/tips via e-mail at colin.charles@percona.com or on Twitter @bytebot.