In this blog post, we’ll review additional Amazon Aurora MySQL monitoring capabilities we’ve added in Percona Monitoring and Management (PMM) 1.7.0. You can see them in action in the MySQL Amazon Aurora Metrics dashboard.
Amazon Aurora MySQL Transaction Commits
This graph looks at the number of commits the Amazon Aurora engine performed, as well as the average commit latency. As you can see from this graph, latency does not always correlate with the number of commits performed and can be quite high in certain situations.
Amazon Aurora MySQL Load
In Percona Monitoring and Management, we often use the concept of “Load” – which roughly corresponds to the number of operations of a type in progress. This graph shows us what statements contribute the most load on the system, as well as what load corresponds to the Amazon Aurora transaction commits (which we observed in the graph before).
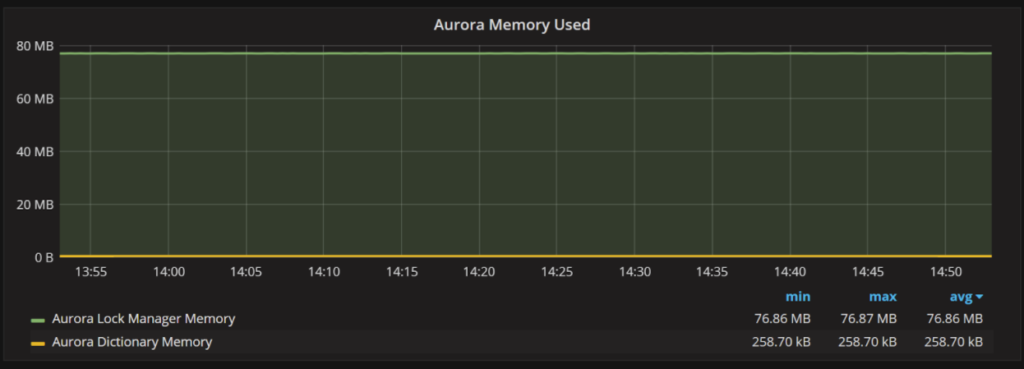
Amazon Aurora MySQL Memory Usage
This graph is pretty self-explanatory. It shows how much memory is used by the Amazon Aurora lock manager, as well as the amount of memory used by Amazon Aurora to store Data Dictionary.
Amazon Aurora MySQL Statement Latency
This graph shows the average latency for the most important types of statements. Latency spikes, as shown in this example, are often indicative of the instance overload.
Amazon Aurora MySQL Special Command Counters
Amazon Aurora MySQL allows a number of commands that are not available in standard MySQL. This graph shows the usage of such commands. Regular “unit_test” calls can be seen in the default Amazon Aurora install, and the rest depends on your workload.
Amazon Aurora MySQL Problems
This graph is where you want to see a flat line. It shows different kinds of internal Amazon Aurora MySQL problems, which in normal operation should generally be zero.
I hope you find these Amazon Aurora MySQL monitoring improvements useful. Let us know if there is any other Amazon Aurora information that would be helpful to display!


