Percona XtraDB Cluster 5.6.43-28.32 Is Now Available

Percona XtraDB Cluster 5.7

Percona XtraDB Cluster 5.7

Percona is glad to announce the release of Percona XtraDB Cluster 5.6.43-28.32 on February 28, 2019. Binaries are available from the downloads section or from our software repositories.

This release of Percona XtraDB Cluster includes the support of Ubuntu 18.10 (Cosmic Cuttlefish). Percona XtraDB Cluster 5.6.43-28.32 is now the current release, based on the following:

All Percona software is open-source and free.

Bugs Fixed

  • PXC-2388: In some cases, DROP FUNCTION function_name was not replicated.

Help us improve our software quality by reporting any bugs you encounter using our bug tracking system. As always, thanks for your continued support of Percona!

Upcoming Webinar Wed 3/6: High Availability and Disaster Recovery in Amazon RDS

High Availability and Disaster Recovery in Amazon RDS Webinar

MySQL High Availability and Disaster Recovery WebinarJoin Percona CEO Peter Zaitsev as he presents High Availability and Disaster Recovery in Amazon RDS on Wednesday, March 6th, 2019, at 11:00 AM PST (UTC-8) / 2:00 PM EST (UTC-5).

Register Now

In this hour-long webinar, Peter describes the differences between high availability (HA) and disaster recovery (DR). Afterward, Peter will go through scenarios detailing how each is handled manually and in Amazon RDS.

He will review the pros and cons of managing HA and DR in the traditional database environment as well in the cloud. Having full control of these areas is daunting. However, Amazon RDS makes meeting these needs easier and more efficient.

Regardless of which path you choose, monitoring your environment is vital. Peter’s talk will make that message clear. A discussion of metrics you should regularly review to keep your environment working correctly and performing optimally concludes the webinar.

In order to learn more register for Peter’s webinar on High Availability and Disaster Recovery in Amazon RDS.

Percona XtraBackup 8.0.5 Is Now Available

Percona XtraBackup 8.0

Percona XtraBackup 8.0

Percona is glad to announce the release of Percona XtraBackup 8.0.5 on March 4, 2019. Downloads are available from our download site and from apt and yum repositories.

Percona XtraBackup enables MySQL backups without blocking user queries, making it ideal for companies with large data sets and mission-critical applications that cannot tolerate long periods of downtime. Offered free as an open source solution, it drives down backup costs while providing unique features for MySQL backups.

Percona XtraBackup 8.0.5 introduces the support of undo tablespaces created using the new syntax (CREATE UNDO TABLESPACEavailable since MySQL 8.0.14. Percona XtraBackup also supports the binary log encryption introduced in MySQL 8.0.14.

Two new options were added to xbstream. Use the --decompress option with xbstream to decompress individual qpress files. With the --decompress-threads option, specify the number of threads to apply when decompressing. Thanks to Rauli Ikonen for this contribution.

This release of Percona XtraBackup is a General Availability release ready for use in a production environment.

All Percona software is open-source and free.

Please note the following about this release:

  • The deprecated innobackupex has been removed. Use the xtrabackup command to back up your instances: $ xtrabackup --backup --target-dir=/data/backup
  • When migrating from earlier database server versions, backup and restore and using Percona XtraBackup 2.4 and then use mysql_upgrade from MySQL 8.0.x
  • If using yum or apt repositories to install Percona XtraBackup 8.0.5, ensure that you have enabled the new tools repository. You can do this with the percona-release enable tools release command and then install the percona-xtrabackup-80 package.

New Features

  • PXB-1548: Percona XtraBackup enables updating the ib_buffer_pool file with the latest pages present in the buffer pool using the --dump-innodb-buffer-pool option. Thanks to Marcelo Altmann for contribution.
  • PXB-1768: Added support for undo tablespaces created with the new MySQL 8.0.14 syntax.
  • PXB-1781: Added support for binary log encryption introduced in MySQL 8.0.14.
  • PXB-1797: For xbstream, two new options were added. The --decompress option enables xbstream to decompress individual qpress files. The --decompress-threads option controls the number of threads to apply when decompressing. Thanks to Rauli Ikonen for this contribution.

Bugs Fixed

  • Using --lock-ddl-per-table caused the server to scan all records of partitioned tables which could lead to the “out of memory” error. Bugs fixed PXB-1691 and PXB-1698.
  • When Percona XtraBackup was started run with the --slave-info, incorrect coordinates were written to the xtrabackup_slave_info file. Bug fixed PXB-1737
  • Percona XtraBackup could crash at the prepare stage when making an incremental backup if the variable innodb-rollback-segments was changed after starting the MySQL Server. Bug fixed PXB-1785.
  • The full backup could fail when Percona Server was started with the --innodb-encrypt-tables parameter. Bug fixed PXB-1793.

Other bugs fixed: PXB-1632PXB-1715PXB-1770PXB-1771PXB-1773.

How to Upgrade Amazon Aurora MySQL from 5.6 to 5.7

Over time, software evolves and it is important to stay up to date if you want to benefit from new features and performance improvements.  Database engines follow the exact same logic and providers are always careful to provide an easy upgrade path. With MySQL, the mysql_upgrade tool serves that purpose.

A database upgrade process becomes more challenging in a managed environment like AWS RDS where you don’t have shell access to the database host and don’t have access to the SUPER MySQL privilege. This post is a collaboration between Fattmerchant and Percona following an engagement focused on the upgrade of the Fattmerchant database from Amazon Aurora MySQL 5.6 to Amazon Aurora MySQL 5.7. Jacques Fu, the CTO of Fattmerchant, is the co-author of this post.  Our initial plan was to follow a path laid out previously by others but we had difficulties finding any complete and detailed procedure outlining the steps. At least, with this post, there is now one.

Issues with the regular upgrade procedure

How do we normally upgrade a busy production server with minimal downtime?  The simplest solution is to use a slave server with the newer version. Such a procedure has the side benefit of providing a “staging” database server which can be used to test the application with the new version. Basically we need to follow these steps:

  1. Enable replication on the old server
  2. Make a consistent backup
  3. Restore the backup on a second server with the newer database version – it can be a temporary server
  4. Run mysql_upgrade if needed
  5. Configure replication with the old server
  6. Test the application against the new version. If the tests includes conflicting writes, you may have to jump back to step 3
  7. If tests are OK and the new server is in sync, replication wise, with the old server, stop the application (only for a short while)
  8. Repoint the application to the new server
  9. Reset the slave
  10. Start the application

If the new server was temporary, you’ll need to repeat most of the steps the other way around, this time starting from the new server and ending on the old one.

What we thought would be a simple task turned out to be much more complicated. We were preparing to upgrade our database from Amazon Aurora MySQL 5.6 to 5.7 when we discovered that there was no option for an in-place upgrade. Unlike a standard AWS RDS MySQL (RDS MySQL upgrade 5.6 to 5.7) at the time of this article you cannot perform an in-place upgrade or even restore a backup across the major versions of Amazon Aurora MySQL.

We initially chose Amazon Aurora for the benefits of the tuning work that AWS provided out of the box, but we realized with any set of pros there comes a list of cons. In this case, the limitations meant that something that should have been straightforward took us off the documented path.

Our original high-level plan

Since we couldn’t use an RDS snapshot to provision a new Amazon Aurora MySQL 5.7 instance, we had to fallback to the use of a logical backup. The intended steps were:

  1. Backup the Amazon Aurora MySQL 5.6 write node with mysqldump
  2. Spin up an empty Amazon Aurora MySQL 5.7 cluster
  3. Restore the backup
  4. Make the Amazon Aurora MySQL 5.7 write node a slave of the Amazon Aurora MySQL 5.6 write node
  5. Once in sync, transfer the application to the Amazon Aurora MySQL 5.7 cluster

Even those simple steps proved to be challenging.

Backup of the Amazon Aurora MySQL 5.6 cluster

First, the Amazon Aurora MySQL 5.6 write node must generate binary log files. The default cluster parameter group that is generated when creating an Amazon Aurora instance does not enable these settings. Our 5.6 write node was not generating binary log files, so we copied the default cluster parameter group to a new “replication” parameter group and changed the “binlog_format” variable to MIXED.  The parameter is only effective after a reboot, so overnight we rebooted the node. That was a first short downtime.

At that point, we were able to confirm, using “show master status;” that the write node was indeed generating binlog files.  Since our procedure involves a logical backup and restore, we had to make sure the binary log files are kept for a long enough time. With a regular MySQL server the variable “expire_logs_days” controls the binary log files retention time. With RDS, you have to use the mysql.rds_set_configuration. We set the retention time to two weeks:

CALL mysql.rds_set_configuration('binlog retention hours', 336);

You can confirm the new setting is used with:

CALL mysql.rds_show_configuration;

For the following step, we needed a mysqldump backup along with its consistent replication coordinates. The option

--master-data

   of mysqldump implies “Flush table with read lock;” while the replication coordinates are read from the server.  A “Flush table” requires the SUPER privilege and this privilege is not available in RDS.

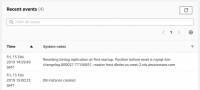
Since we wanted to avoid downtime, it is out of question to pause the application for the time it would take to backup 100GB of data. The solution was to take a snapshot and use it to provision a temporary Amazon Aurora MySQL 5.6 cluster of one node. As part of the creation process, the events tab of the AWS console will show the binary log file and position consistent with the snapshot, it looks like this:

Consistent snapshot replication coordinates

Consistent snapshot replication coordinates

From there, the temporary cluster is idle so it is easy to back it up with mysqldump. Since our dataset is large we considered the use of MyDumper but the added complexity was not worthwhile for a one time operation. The dump of a large database can take many hours. Essentially we performed:

mysqldump -h entrypoint-temporary-cluster -u awsrootuser -pxxxx 
 --no-data --single-transaction -R -E -B db1 db2 db3 > schema.sql
mysqldump -h entrypoint-temporary-cluster -nt --single-transaction 
 -u awsrootuser -pxxxx -B db1 db2 db3 | gzip -1 > dump.sql.gz
pt-show-grants -h entrypoint-temporary-cluster -u awsrootuser -pxxxx > grants.sql

The schema consist of three databases: db1, db2 and db3.  We have not included the mysql schema because it will cause issues with the new 5.7 instance. You’ll see why we dumped the schema and the data separately in the next section.

Restore to an empty Amazon Aurora MySQL 5.7 cluster

With our backup done, we are ready to spin up a brand new Amazon Aurora MySQL 5.7 cluster and restore the backup. Make sure the new Amazon Aurora MySQL 5.7 cluster is in a subnet with access to the Amazon Aurora MySQL 5.6 production cluster. In our schema, there a few very large tables with a significant number of secondary keys. To speed up the restore, we removed the secondary indexes of these tables from the schema.sql file and created a restore-indexes.sql file with the list of alter table statements needed to recreate them. Then we restored the data using these steps:

cat grants.sql | mysql -h entrypoint-new-aurora-57 -u awsroot -pxxxx
cat schema-modified.sql | mysql -h entrypoint-new-aurora-57 -u awsroot -pxxxx
zcat dump.sql.gz | mysql -h entrypoint-new-aurora-57 -u awsroot -pxxxx
cat restore-indexes.sql | mysql -h entrypoint-new-aurora-57 -u awsroot -pxxxx

Configure replication

At this point, we have a new Amazon Aurora MySQL 5.7 cluster provisioned with a dataset at a known replication coordinates from the Amazon Aurora MySQL 5.6 production cluster.  It is now very easy to setup replication. First we need to create a replication user in the Amazon Aurora MySQL 5.6 production cluster:

GRANT REPLICATION CLIENT, REPLICATION SLAVE ON *.* TO 'repl_user'@'%' identified by 'agoodpassword';

Then, in the new Amazon Aurora MySQL 5.7 cluster, you configure replication and start it by:

CALL mysql.rds_set_external_master ('mydbcluster.cluster-123456789012.us-east-1.rds.amazonaws.com', 3306,
  'repl_user', 'agoodpassword', 'mysql-bin-changelog.000018', 65932380, 0);
CALL mysql.rds_start_replication;

The endpoint mydbcluster.cluster-123456789012.us-east-1.rds.amazonaws.com points to the Amazon Aurora MySQL 5.6 production cluster.

Now, if everything went well, the new Amazon Aurora MySQL 5.7 cluster will be actively syncing with its master, the current Amazon Aurora MySQL 5.6 production cluster. This process can take a significant amount of time depending on the write load and the type of instance used for the new cluster. You can monitor the progress with the show slave statusG command, the Seconds_Behind_Master will tell you how far behind in seconds the new cluster is compared to the old one.  It is not a measurement of how long it will take to resync.

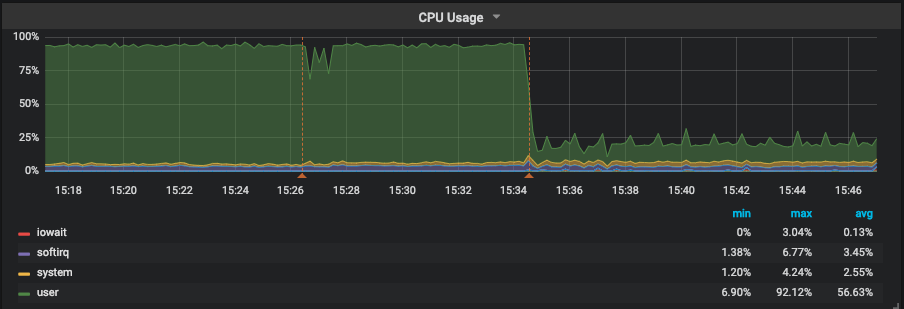
You can also monitor throughput using the AWS console. In this screenshot you can see the replication speeding up over time before it peaks when it is completed.

Replication speed

Test with Amazon Aurora MySQL 5.7

At this point, we have an Amazon Aurora MySQL 5.7 cluster in sync with the production Amazon Aurora MySQL 5.6 cluster. Before transferring the production load to the new cluster, you need to test your application with MySQL 5.7. The easiest way is to snapshot the new Amazon Aurora MySQL 5.7 cluster and, using the snapshot, provision a staging Amazon Aurora MySQL 5.7 cluster. Test your application against the staging cluster and, once tested, destroy the staging cluster and any unneeded snapshots.

Switch production to the Amazon Aurora MySQL 5.7 cluster

Now that you have tested your application with the staging cluster and are satisfied how it behaves with Amazon Aurora MySQL 5.7, the very last step is to migrate the production load. Here are the last steps you need to follow:

  1. Make sure the Amazon Aurora MySQL 5.7 cluster is still in sync with the Amazon Aurora MySQL 5.6 cluster
  2. Stop the application
  3. Validate the Show master status; of the 5.6 cluster is no longer moving
  4. Validate from the Show slave statusG in the 5.7 cluster the Master_Log_File and Exec_Master_Log_Pos match the output of the “Show master status;” from the 5.6 cluster
  5. Stop the slave in the 5.7 cluster with CALL mysql.rds_stop_replication;
  6. Reset the slave in the 5.7 cluster with CALL mysql.rds_reset_external_master;
  7. Reconfigure the application to use the 5.7 cluster endpoint
  8. Start the application

The application is down from steps 2 to 8.  Although that might appear to be a long time, these steps can easily be executed within a few minutes.

Summary

So, in summary, although RDS Aurora doesn’t support an in place upgrade between Amazon Aurora MySQL 5.6 and 5.7, there is a possible migration path, minimizing downtime.  In our case, we were able to limit the downtime to only a few minutes.

Co-Author: Jacques Fu, Fattmerchant


Jacques is CTO and co-founder at the fintech startup Fattmerchant, author of Time Hacks, and co-founder of the Orlando Devs, the largest developer meetup in Orlando. He has a passion for building products, bringing them to market, and scaling them.

Upcoming Webinar Thurs 3/7: Enhancing MySQL Security

Enhancing MySQL Security Webinar

Enhancing MySQL Security WebinarJoin Percona Support Engineer, Vinicius Grippa, as he presents his talk Enhancing MySQL Security on Thursday, March 7th, 2019 at 7:00 AM PST (UTC-8) / 10:00 AM EST (UTC-5).

Register Now

Security is always a challenge when it comes to data. What’s more, regulations like GDPR add a whole new layer on top of it, with rules more and more restrictive to access and manipulate data. Join us in this presentation to check security best practices, as well as traditional and new features available for MySQL including features coming with the new MySQL 8.

In this talk, DBA’s and sysadmins will walk through the security features available on the OS and MySQL. For instance, these features include:

– SO security
– SSL
– ACL
– TDE
– Audit Plugin
– MySQL 8 features (undo, redo and binlog encryption)
– New caching_sha2_password
– Roles
– Password Management
– FIPS mode

In order to learn more register for this webinar on Enhancing MySQL Security.

Reducing High CPU on MySQL: a Case Study

CPU Usage after query tuning

In this blog post, I want to share a case we worked on a few days ago. I’ll show you how we approached the resolution of a MySQL performance issue and used Percona Monitoring and Management PMM to support troubleshooting. The customer had noticed a linear high CPU usage in one of their MySQL instances and was not able to figure out why as there was no much traffic hitting the app. We needed to reduce the high CPU usage on MySQL. The server is a small instance:

Models | 6xIntel(R) Xeon(R) CPU E5-2430 0 @ 2.20GHz
10GB RAM

This symptom can be caused by various different reasons. Let’s see how PMM can be used to troubleshoot the issue.

CPU

The original issue - CPU usage at almost 100% during application use

It’s important to understand where the CPU time is being consumed: user space, system space, iowait, and so on. Here we can see that CPU usage was hitting almost 100% and the majority of the time was being spent on user space. In other words, the time the CPU was executing user code, such as MySQL. Once we determined that the time was being spent on user space, we could discard other possible issues. For example, we could eliminate the possibility that a high amount of threads were competing for CPU resources, since that would cause an increase in context switches, which in turn would be taken care of by the kernel – system space.

With that we decided to look into MySQL metrics.

MySQL

Thread activity graph in PMM for MySQL

Queries per second

As expected, there weren’t a lot of threads running—10 on average—and MySQL wasn’t being hammered with questions/transactions. It was running from 500 to 800 QPS (queries per second). Next step was to check the type of workload that was running on the instance:

All the commands are of a SELECT type, in red in this graph

In red we can see that almost all commands are SELECTS. With that in mind, we checked the handlers using 

SHOW STATUS LIKE 'Handler%'

 to verify if those selects were doing an index scan, a full table scan or what.

Showing that the query was a full table scan

Blue in this graph represents

Handler_read_rnd_next

 , which is the counter MySQL increments every time it reads a row when it’s doing a full table scan. Bingo!!! Around 350 selects were reading 2.5 million rows. But wait—why was this causing CPU issues rather than IO issues? If you refer to the first graph (CPU graph) we cannot see iowait.

That is because the data was stored in the InnoDB Buffer Pool, so instead of having to read those 2.5M rows per second from disk, it was fetching them from memory. The stress had moved from disk to CPU. Now that we identified that the issue had been caused by some queries or query, we went to QAN to verify the queries and check their status:

identifying the long running query in QAN

First query, a

SELECT

  on table 

store.clients

 was responsible for 98% of the load and was executing in 20+ seconds.

The initial query load

EXPLAIN confirmed our suspicions. The query was accessing the table using type ALL, which is the last type we want as it means “Full Table Scan”. Taking a look into the fingerprint of the query, we identified that it was a simple query:

Fingerprint of query
Indexes on table did not include a key column

The query was filtering clients based on the status field

SELECT * FROM store.clients WHERE status = ?

 As shown in the indexes, that column was not indexed. Talking with the customer, this turned out to be a query that was introduced as part of a new software release.

From that point, we were confident that we had identified the problem. There could be more, but this particular query was definitely hurting the performance of the server. We decided to add an index and also sent an annotation to PMM, so we could refer back to the graphs to check when the index has been added, check if CPU usage had dropped, and also check Handler_read_rnd_next.

To run the alter we decided to use pt-online-schema-change as it was a busy table, and the tool has safeguards to prevent the situation from becoming even worse. For example, we wanted to avoid pausing or even aborting the alter in the case of the number of Threads_Running exceeding a certain threshold. The threshold is controlled by

--max-load

  (25 by default) and

--critical-load

  (50 by default):

pmm-admin annotate "Started ALTER store.clients ADD KEY (status)" && 
pt-online-schema-change --alter "ADD KEY (status)" --execute u=root,D=store,t=clients && 
pmm-admin annotate "Finished ALTER store.clients ADD KEY (status)"
Your annotation was successfully posted.
No slaves found. See --recursion-method if host localhost.localdomain has slaves.
Not checking slave lag because no slaves were found and --check-slave-lag was not specified.
Operation, tries, wait:
analyze_table, 10, 1
copy_rows, 10, 0.25
create_triggers, 10, 1
drop_triggers, 10, 1
swap_tables, 10, 1
update_foreign_keys, 10, 1
Altering `store`.`clients`...
Creating new table...
Created new table store._clients_new OK.
Altering new table...
Altered `store`.`_clients_new` OK.
2019-02-22T18:26:25 Creating triggers...
2019-02-22T18:27:14 Created triggers OK.
2019-02-22T18:27:14 Copying approximately 4924071 rows...
Copying `store`.`clients`: 7% 05:46 remain
Copying `store`.`clients`: 14% 05:47 remain
Copying `store`.`clients`: 22% 05:07 remain
Copying `store`.`clients`: 30% 04:29 remain
Copying `store`.`clients`: 38% 03:59 remain
Copying `store`.`clients`: 45% 03:33 remain
Copying `store`.`clients`: 52% 03:06 remain
Copying `store`.`clients`: 59% 02:44 remain
Copying `store`.`clients`: 66% 02:17 remain
Copying `store`.`clients`: 73% 01:50 remain
Copying `store`.`clients`: 79% 01:23 remain
Copying `store`.`clients`: 87% 00:53 remain
Copying `store`.`clients`: 94% 00:24 remain
2019-02-22T18:34:15 Copied rows OK.
2019-02-22T18:34:15 Analyzing new table...
2019-02-22T18:34:15 Swapping tables...
2019-02-22T18:34:27 Swapped original and new tables OK.
2019-02-22T18:34:27 Dropping old table...
2019-02-22T18:34:32 Dropped old table `store`.`_clients_old` OK.
2019-02-22T18:34:32 Dropping triggers...
2019-02-22T18:34:32 Dropped triggers OK.
Successfully altered `store`.`clients`.
Your annotation was successfully posted.

Results

MySQL Handlers after query tuning MySQL query throughput after query tuning
Query analysis by EXPLAIN in PMM after tuning

As we can see, above, CPU usage dropped to less than 25%, which is 1/4 of the previous usage level. Handler_read_rnd_next dropped and we can’t even see it once pt-osc has finished. We had a small increase on Handler_read_next as expected because now MySQL is using the index to resolve the WHERE clause. One interesting outcome is that the instance was able to increase it’s QPS by 2x after the index was added as CPU/Full Table Scan was no longer limiting performance. On average, query time has dropped from 20s to only 661ms.

Summary:

  1. Applying the correct troubleshooting steps to your problems is crucial:
    a) Understand what resources have been saturated.
    b) Understand what if anything is causing an error.
    c) From there you can divert into the areas that are related to that resource and start to narrow down the issue.
    d) Tackle the problems bit by bit.
  2. Having the right tools for the job key for success. PMM is a great example of a tool that can help you quickly identify, drill in, and fix bottlenecks.
  3. Have realistic load tests. In this case, they had tested the new release on a concurrency level that was not like their production
  4. By identifying the culprit query we were able to:
    a.) Drop average query time from 20s to 661ms
    b.) Increase QPS by 2x
    c.) Reduce the usage of CPU to 1/4 of its level prior to our intervention

Disclosure: For security reasons, sensitive information, such as database, table, column names have been modified and graphs recreated to simulate a similar problem.

Does Percona Monitoring and Management (PMM) Support External Monitoring Services? Yes It Does!

External Monitoring Services

Percona Monitoring and Management (PMM) is a free and open-source platform for managing and monitoring MySQL and MongoDB performance. You can run PMM in your own environment for maximum security and reliability. It provides thorough time-based analysis for MySQL and MongoDB servers to ensure that your data works as efficiently as possible.

Starting with version 1.4.0 and improved in 1.7.0, PMM supports external monitoring services. This means you can plug in Prometheus exporters for technologies not directly provided by Percona. For example, you can start monitoring the metrics of your PostgreSQL database host, Memcached or Redis.

Exporters Overview

Applications store their metrics in arbitrary formats, and Prometheus exporters collect them and produce (or export to) a consistent format of key-value pairs. The keys refer to metric types and values are numbers in the float 64 format. Due to the diversity of formats that applications may use, you should program a specific exporter for each format. However, if you decide to make the metrics of your application available via PMM you may consider using one of existing Prometheus exporters.

Currently, PMM offers exporters for MySQL (mysqld_exporter) and MongoDB (mongodb_exporter) database management systems. Built-in exporters also exist for Percona XtraDBCluster, MariaDB, RDS and Aurora via mysqld_exporter and for ProxySQL (via proxysql_exporter). These exporters are made available as monitoring services that you can add or remove as necessary. In addition, PMM includes the node_exporter to capture the host level Linux metrics such as CPU, Load, and disk resources.

Using Exporters

On the computer where the PMM client is installed and connected to a PMM server, make use of the pmm-admin utility to add any built-in monitoring service directly. There is no extra effort in this case: the added monitoring service will run its exporter and all required configuration updates are made automatically to make the metrics available in the web interface for further analysis in Query analytics and Metrics monitor.

In case of external monitoring services, you need to locate, download, set up and run the specific Prometheus exporter to collect metrics. When it is ready, you can add it as a monitoring service:

pmm-admin add external:service job_name [instance] --service-port=PORT_NUMBER

This command adds an external monitoring service bound to the Prometheus job that you specify as the job_name parameter. You should also provide the port associated with this Prometheus job as the value of the service-port parameter. The instance parameter is optional. By default, it is assigned the name of the host where you run pmm-admin.

Example 1: Adding a PostgreSQL Monitoring Service

In order to add an external monitoring service for a PostgreSQL database server, make sure to install and configure your PostgreSQL server. Then, select a PostgreSQL Prometheus exporter from the list available from the  Prometheus site, such as PostgreSQL metric exporter for Prometheus. Refer to the documentation for this exporter for details about how to install and set it up.

As soon as your Prometheus exporter can collect metrics from your PostgreSQL database server,  you are ready to add this exporter as a monitoring service. Make sure that you have access to a configured PMM server and your PMM client has been set up to use it. Use the pmm-admin utility, which is part of PMM client, to add the PostgreSQL monitoring service. Assuming postgresql is the name of this monitoring service, your command should look like this:

pmm-admin add external:service --service-port=PORT_NUMBER postgresql

It is time now to display the metrics on the PMM Server. Open Metrics Monitor and check the Advanced Data Exploration dashboard. This can dashboard visualize a lot of metrics including those exposed by external monitoring services. In the Host field select your host. Use the Metric field to select a metric.

External Monitoring Services
Viewing a metric exposed by a PostgreSQL exporter.

Setting up an external monitoring service requires extra work compared to adding built-in monitoring services. However, by using external monitoring services you can considerably extend the capabilities of your PMM installation.

Note that running the pmm-admin list command lists the added external monitoring services. They also appear in the JSON output, too. To remove an external service use the remove (or its short form rm) command:

pmm-admin rm external:service --service-port=PORT_NUMBER NAME_OF_EXTERNAL_MONITORING_SERVICE

$ sudo pmm-admin list
pmm-admin 1.7.0
PMM Server      | 192.0.2.2 (password-protected)
Client Name     | postgres01
Client Address  | 192.0.2.3
Service Manager | unix-systemv
Job name    Scrape interval  Scrape timeout  Metrics path  Scheme  Target         Labels                   Health
postgresql  1s               1s              /metrics      http    192.0.2.3:9187 instance="postgres01"      UP

Example 2: Adding a Redis Monitoring Service

To start with, you must install a Prometheus exporter for Redis (this exporter is listed on the Prometheus Exporters and Integrations page) on the machine where your PMM client runs. The following command adds this exporter as an external monitoring service (run it as a superuser or use sudo). This time the command has an extra parameter:

$ sudo pmm-admin add external:service redis --service-port 9121 redis01
External service added.

Notice that we use Redis Server as the last parameter passed to pmm-admin add external:service command. The last positional parameter is a label that you assign to this particular instance.

pmm-admin add external:service --service-port=PORT_NUMBER NAME_OF_EXTERNAL_MONITORING_SERVICE [INSTANCE_LABEL]

You may choose any name for this purpose. Make sure to use quotes if you decide to use a label made of two or more words.

$ sudo pmm-admin list
pmm-admin 1.7.0
PMM Server | 127.0.0.1
Client Name | percona
Client Address | 172.17.0.1
Service Manager | linux-systemd
No services under monitoring.
Job name Scrape interval Scrape timeout Metrics path Scheme Target          Labels                  Health
redis    1m0s            10s            /metrics     http   172.17.0.1:9121 instance="redis01"      UP

To view Redis related metrics you need to open the Advanced Data Exploration dashboard on your PMM Server. The redis01 label automatically appears in the Host field in the Advanced Data Exploration dashboard. In the Host field, select the redis01 option and choose a metric to view from the Metric field, such as redis_exporter_scrapes_total.

Other Ways to Add External Services

The pmm-admin add external:service command is the recommended way to add an external monitoring service. There exist other, more specific, methods. The pmm-admin add external:metrics adds external Prometheus exporters job to metrics monitoring.

Webinar Thursday, February 15, 2018: Basic Internal Troubleshooting Tools for MySQL Server

Troubleshooting Tools for MySQL

Troubleshooting Tools for MySQLPlease join Percona’s Principal Support Engineer, Sveta Smirnova, as she presents “Basic Internal Troubleshooting Tools for MySQL Server” on Thursday, February 15, 2018, at 10:00 am PST (UTC-8) / 1:00 pm EST (UTC-5).


MySQL Server has many built-in troubleshooting tools. They are always available and can provide many insights on what is happening internally. Many graphical tools, such as Percona Monitoring and Management (PMM), use built-ins to get data for their nice graphs.

Even if you are only going to use graphical tools, it is always good to know what data they can collect. This way, you can see their limitations and won’t have incorrect expectations in the heat of battle. Built-in troubleshooting tools are accessible via SQL commands. Most of them are standard across the server, but details are component-specific.

In this webinar, I will discuss how to use them, how to troubleshoot component-specific issues and how to find additional information. I will cover SHOW commands, Information Schema, status variables and few component-specific syntaxes. I will NOT cover Performance Schema (there will be a separate webinar on that), and I will use PMM graphs to illustrate the topics whenever possible.

Register for the Basic Internal Troubleshooting Tools for MySQL Server webinar now.

Internal Troubleshooting for MySQLSveta Smirnova, Principal Technical Services Engineer

Sveta joined Percona in 2015. Her main professional interests are problem-solving, working with tricky issues, bugs, finding patterns that can solve typical issues quicker. She likes teaching others how to deal with MySQL issues, bugs and gotchas effectively. Before joining Percona Sveta worked as Support Engineer in MySQL Bugs Analysis Support Group in MySQL AB-Sun-Oracle. She is the author of book “MySQL Troubleshooting” and JSON UDF functions for MySQL.

Percona Server for MySQL 5.6.39-83.1 Is Now Available

Percona Server for MySQL 5.6

Percona Server for MySQL 5.6Percona announces the release of Percona Server for MySQL 5.6.39-83.1 on February 13, 2018. Based on MySQL 5.6.39, including all the bug fixes in it, Percona Server for MySQL 5.6.39-83.1 is now the current stable release in the 5.6 series.

Percona Server for MySQL is open-source and free. Downloads are available here and from the Percona Software Repositories.

Bugs Fixed
  • With innodb_large_prefix set to 1, Blackhole storage engine was incompatible with InnoDB table definitions, thus adding new indexes would cause replication errors on the slave. Fixed #1126 (upstream #53588).
  • Intermediary slave with Blackhole storage engine couldn’t record updates from master to its own binary log in case master has binlog_rows_query_log_events option enabled. Bug fixed #1119 (upstream #88057).
  • A build error on FreeBSD caused by fixing the bug #255 was present. Bug fixed #2284.
  • Server queries that contained JSON special characters and were logged by audit_log plugin in JSON format caused invalid output due to lack of escaping. Bug fixed #1115.
  • Compilation warnings fixed in sql_planner.cc  module. Bug fixed #3632 (upstream #77637).
  • A memory leak fixed in PFS unit test. Bug fixed #1806 (upstream #89384).
  • A GCC 7 warning fix introduced regression in Percona Server for MySQL 5.6.38-83.0 that lead to a wrong SQL query built to access the remote server when Federated storage engine was used. Bug fixed #1134.
  • Percona Server now uses Travis CI  for additional tests. Bug fixed #3777.

Other bugs fixed: #257, #1090 (upstream #78048), #1127, and #2415.

This release also contains fixes for the following CVE issues: CVE-2018-2562,
CVE-2018-2573, CVE-2018-2583, CVE-2018-2590, CVE-2018-2591, CVE-2018-2612,
CVE-2018-2622, CVE-2018-2640, CVE-2018-2645, CVE-2018-2647, CVE-2018-2665,
CVE-2018-2668, CVE-2018-2696, CVE-2018-2703, CVE-2017-3737.

TokuDB Changes
  • Percona fixed a memory leak in the PerconaFT library. Bug fixed #TDB-98.
  • A clang-format configuration was added to PerconaFT and TokuDB (bug fixed #TDB-104).

Other bugs fixed: #TDB-48, #TDB-78, #TDB-93, and #TDB-99.

Find the release notes for Percona Server for MySQL 5.6.39-83.1 in our online documentation. Report bugs in the Jira bug tracker.

Want IST Not SST for Node Rejoins? We Have a Solution!

IST Not SST for Node Rejoins

IST Not SST for Node RejoinsWhat if we tell you that there is a sure way to get IST not SST for node rejoins? You can guarantee that a new node rejoins using IST. Sound interesting? Keep reading.

Normally when a node is taken out of the cluster for a short period of time (for maintenance or shutdown), gcache on other nodes of the cluster help donate the missing write-set(s) when the node rejoins. This approach works if you have configured a larger gcache, or the downtime is short enough. Both approaches aren’t good, especially for a production cluster. Also, a larger gcache for the server lifetime means blocking larger disk-space when the same job can be done with relative smaller disk-space.

Re-configuring gcache, on a potential DONOR node before downtime requires a node shutdown. (Dynamic resizing of the gcache is not possible, or rather not needed now.) Restoring it back to original size needs another shutdown. So “three shutdowns” for a single downtime. No way …… not acceptable with busy production clusters and the possibility of more errors.

Introducing “gcache.freeze_purge_at_seqno”

Given the said pain-point, we are introducing gcache.freeze_purge_at_seqno Percona XtraDB Cluster 5.7.20. This controls the purging of the gcache, thereby retaining more data to facilitate IST when the node rejoins.

All the transactions in the Galera cluster world are assigned unique global sequence number (seqno). Tracking things happens using this seqno (like wsrep_last_applied, wsrep_last_committed, wsrep_replicated, wsrep_local_cached_downto, etc…). wsrep_local_cached_downto represents the sequence number down to which the gcache has been purged. Say wsrep_local_cached_downto = N, then gcache has data from [N, wsrep_replicated] and has purged data from [1,N).

gcache.freeze_purge_at_seqno takes three values:

  1. -1 (default): no freeze, the purge operates as normal.
  2. x (should be valid seqno in gcache): freeze purge of write-sets >= x. The best way to select x is to use the wsrep_last_applied value as an indicator from the node that you plan to shut down. (wsrep_applied * 0.09. Retain this extra 10% to trick the safety gap heuristic algorithm of IST.)
  3. now: freeze purge of write-sets >= smallest seqno currently in gcache. Instant freeze of gcache-purge. (If tracing x (above) is difficult, simply use “now” and you are good).

Set this on an existing node of the cluster (that will continue to be part of the cluster and can act as potential DONOR). This node continues to retain the write-sets, thereby allowing the restarting node to rejoin using IST. (You can feed the said node as a preferred DONOR through wsrep_sst_donor while restarting the said rejoining node.)

Remember to set it back to -1 once the node rejoins. This avoids hogging space on the DONOR beyond the said timeline. On the next purge cycle, all the old retained write-sets are freed as well (reclaiming the space back to original).

Note:

To find out existing value of gcache.freeze_purge_at_seqno query wsrep_provider_options.
select @@wsrep_provider_options;
To set gcache.freeze_purge_at_seqno
set global wsrep_provider_options="gcache.freeze_purge_at_seqno = now";

Why should you use it?

  • gcache grows dynamically (using existing pagestore mechanism) and shrinks once the user sets it back to -1. This means you only use disk-space when needed.
  • No restart needed. The user can concentrate on maintenance node only.
  • No complex math or understanding of seqno involved (simply use “now”).
  • Less prone to error, as SST is one of the major error-prone areas with the cluster.

So why wait? Give it a try! It is part of Percona XtraDB Cluster 5.7.20 onwards, and helps you get IST not SST for node rejoins

Note: If you need more information about gcache, check here and here.