The concept of Linux HugePages has existed for quite a while: for more than 10 years, introduced to Debian in 2007 with kernel version 2.6.23. Whilst a smaller page size is useful for general use, some memory intensive applications may gain performance by using bigger memory pages. By having bigger memory chunks available to them, they can reduce lookup time as well as improve the performance of read/write operations. To be able to make use of HugePages, applications need to carry the specific code directive, and changing applications across the board is not necessarily a simple task. So enter Transparent HugePages (THP).
By reputation, THPs are said to have a negative impact on performance. For this post, I set out to either prove or debunk the case for the use of THPs for database applications.
The Linux context
On Linux – and for that matter all operating systems that I know of – memory is divided into small chunks called pages. A typical memory page size is set to 4k. You can obtain the value of page size on Linux using getconf.
# getconf PAGE_SIZE
4096
Generally, the latest processors support multiple page sizes. However, Linux defaults to a minimal 4k page size. For a system with 64GB physical memory, this memory will be divided into more than 16 million pages. Linking between these pages and physical memory (which is called page table walking) is undertaken by the CPU’s memory management unit (MMU). To optimize page lookup, CPU maintains a cache of recently used pages called the Table Lookaside Buffer (TLB). The higher the number of pages, the lower the percentage of pages that are maintained in TLB. This translates to a higher cache miss ratio. With every cache miss, a more expensive search must be done via page table walking. In effect, that leads to a degradation in performance.
So what if we could increase the page size? We could then reduce the number of pages accessed, and reduce the cost of page walking. Cache hit ratio might then improve because more relevant data now fits in one page rather than multiple pages.
The Linux kernel will always try to allocate a HugePage (if enabled) and will fall back to the default 4K if a contiguous chunk of the required memory size is not available in the required memory space.
The implication for applications
As mentioned, for an application to make use of HugePages it has to contain an explicit instruction to do so. It’s not always practical to change applications in this way so there’s another option.
Transparent HugePages provides a layer within the Linux kernel – probably since version 2.6.38 – which if enabled can potentially allocate HugePages for applications without them actually “knowing” it; hence the transparency. The expectation is that this will improve application performance.
In this blog, I’ll attempt to find the reasons why THP might help improve database performance. There’s a lot of discussion amongst database experts that classic HugePages give a performance gain, but you’ll see a performance hit with Transparent HugePages. I decided to take up the challenge and perform various benchmarks, with different settings, and with different workloads.
So do Transparent HugePages (THP) improve application performance? More specifically, do they improve performance for database workloads? Most industry standard databases recommend disabling THP and enabling HugePages alone.
So is this a myth or does THP degrade performance for databases? Time to break this myth.
Enabling THP
The current setting can be seen using the command line
# cat /sys/kernel/mm/transparent_hugepage/enabled
[always] madvise never
Temporary Change
It can be enabled or disabled using the command line.
# echo never > /sys/kernel/mm/transparent_hugepage/enabled
Permanent Change via grub
Or by setting grub parameter in
/etc/default/grub
.
You can choose one of the three configurations for THP; enable, disable, or “madvise”. Whilst enable and disable options are self-explanatory, madvise allows applications that are optimized for HugePages to use THP. Applications can use Transparent HugePages by making the madvise system call.
Why was the madvise option added? We will discuss that in a later section.
Transparent HugePages problems
The khugepaged CPU usage
The allocation of a HugePage can be tricky. Whilst traditional HugePages are reserved in virtual memory, THPs are not. In the background, the kernel attempts to allocate a THP, and if it fails, will default to the standard 4k page. This all happens transparently to the user.
The allocation process can potentially involve a number of kernel processes which may include kswapd, defrag, and kcompactd. All of these are responsible for making space in the virtual memory for a future THP. When required, the allocation is made by another kernel process; khugepaged. This process manages Transparent HugePages.
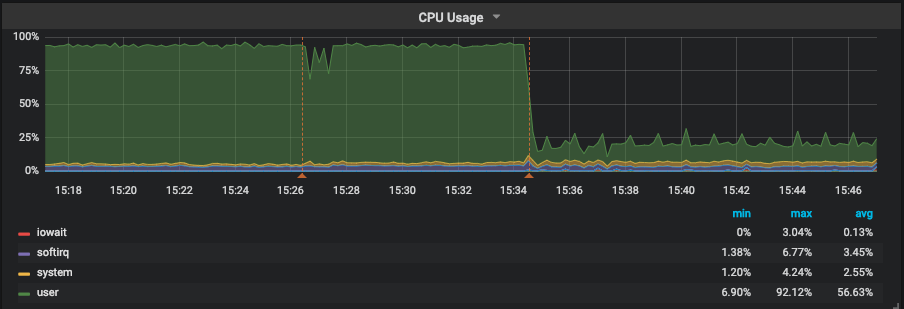
Spikes
It depends on how khugepaged is configured, but since no memory is reserved beforehand, there is potential for performance degradation. With every attempt to allocate a HugePage, potentially a number of kernel processes are invoked. These carry out certain actions to make enough room in the virtual memory for a THP allocation. Although no notifications are provided to the application, precious resources are spent, and this can lead to spikes in performance with any dips indicating an attempt to allocate THP.
Memory Bloating
HugePages are for not for every application. For example, an application that wants to allocate only one byte of data would be better off using a 4k page rather than a huge one. That way, memory is more efficiently used. To prevent this, one option is to configure THP to “madvise”. By doing this, HugePages are disabled system-wide but are available to applications that make a madvise call to allocate THP in the madvise memory region.
Swapping
Linux kernel keeps track of memory pages and differentiates between pages are that are actively being used and the ones that are not immediately required. It may load or unload a page from active memory to disk if that page is no longer required or vice versa.
When page size is 4k, these memory operations are understandably fast. However, consider a 1GB page size: there will a significant performance hit when such a page is swapped out. When a THP is swapped out, it is split in standard page sizes. Unlike conventional HugePages which are reserved in RAM and are never swapped, THPs are swappable pages. They could, therefore, potentially be swapped causing a dip in performance. Although in recent years, there have been loads of performance improvements around swapping out the THPs process, it still does impact performance negatively.
Benchmark
I decided to benchmark with and without Transparent HugePages enabled. Initially, I used pgbench – a PostgreSQL benchmarking tool based on TPCB – for a duration of ten minutes. The benchmark used a mixed mode of READ/WRITE. The results with and without the Transparent HugePages show no degradation or improvement in the benchmark. To be sure, I repeated the same benchmark for 60 minutes and got almost the same results. I performed another benchmark with a TPCC workload using the sysbench benchmarking tool. The results are almost the same.
Benchmark Machine
- Supermicro server:
- Intel(R) Xeon(R) CPU E5-2683 v3 @ 2.00GHz
- 2 sockets / 28 cores / 56 threads
- Memory: 256GB of RAM
- Storage: SAMSUNG SM863 1.9TB Enterprise SSD
- Filesystem: ext4/xfs
- OS: Linux smblade01 4.15.0-42-generic #45~16.04.1-Ubuntu
- PostgreSQL: version 11
Benchmark TPCB (pgbench) – 10 Minute duration
The following graphs show results for two different database sizes; 48GB and 112GB with 64, 128 and 256 clients each. All other settings were kept unchanged for these benchmarks to ensure that our results are comparable. It is evident that both lines — representing execution with or without THP — are almost overlapping one another. This suggests no performance gains.

Figure 1.1 PostgreSQL’ s Benchmark, 10 minutes execution time where database workload(48GB) < shared_buffer (64GB)

Figure 1.2 PostgreSQL’ s Benchmark, 10 minutes execution time where database workload (48GB) > shared_buffer (64GB)

Figure 1.3 PostgreSQL’ s Benchmark, 10 minutes execution time where database workload (48GB) < shared_buffer (64GB) -dTLB-misses

Figure 1.4 PostgreSQL’ s Benchmark, 10 minutes execution time where database workload (112GB) > shared_buffer (64GB)-dTLB-misses
Benchmark TPCB (pgbench) – 60 Minute duration

Figure 2.1 PostgreSQL’ s Benchmark, 60 minutes execution time where database workload (48GB) < shared_buffer (64GB)

Figure 2.2 PostgreSQL’ s Benchmark, 60 minutes execution time where database workload (112GB) > shared_buffer (64GB)

Figure 2.3 PostgreSQL’ s Benchmark, 60 minutes execution time where database workload (48GB) < shared_buffer (64GB) -dTLB-misses

Figure 2.4 PostgreSQL’ s Benchmark, 60 minutes execution time where database workload (112GB) > shared_buffer (64GB) -dTLB-misses
Benchmark TPCC (sysbecnch) – 10 Minute duration

Figure 3.1 PostgreSQL’ s Benchmark, 10 minutes execution time where database workload (48GB) < shared_buffer (64GB)

Figure 3.2 PostgreSQL’ s Benchmark, 10 minutes execution time where database workload (112GB) > shared_buffer (64GB)

Figure 3.3 PostgreSQL’ s Benchmark, 10 minutes execution time where database workload (48GB) < shared_buffer (64GB) -dTLB-misses

Figure 3.4 PostgreSQL’ s Benchmark, 10 minutes execution time where database workload 112GB) > shared_buffer (64GB) -dTLB-misses
Conclusion
I attained these results by running different benchmarking tools and evaluating different OLTP benchmarking standards. The results clearly indicate that for these workloads, THP has a negative impact on the overall database performance. Although the performance degradation is negligible, it is, however, clear that there is no performance gain as one might expect. This is very much in line with all the different databases’ recommendation which suggests disabling the THP.
THP may be beneficial for various applications, but it certainly doesn’t give any performance gains when handling an OLTP workload.
We can safely say that the “myth” is derived from experience and that the rumors are true.
Summary
- The complete benchmark data is available at GitHub[1]
- The complete “nmon” reports, which include CPU, memory etc usage can be found at GitHub[2]
- This whole benchmark is based around OLTP. Watch out for the OLAP benchmark. Maybe THP will have more effect on this type of workload.
[1] – https://github.com/Percona-Lab-results/THP-POSTGRESQL-2019/blob/master/results.xlsx
[2] – https://github.com/Percona-Lab-results/THP-POSTGRESQL-2019/tree/master/results