Percona Monitoring Plugins 1.1.2, now with Amazon RDS support

Percona is glad to announce the release of Percona Monitoring Plugins 1.1.2.

Changelog:

* Added Nagios plugin and Cacti template for Amazon RDS
* Added Nagios config template to the documentation
* Added an option to pmp-check-pt-table-checksum to check MAX(ts) of latest checksum
* Added generic Nagios plugin for PT tables
* Extended pmp-check-mysql-processlist with max user connections check
* Zabbix MySQL.running-slave item failed with MySQL 5.6 (bug 1272358)
* ss_get_mysql_stats and MariaDB does not use have_response_time_distribution (bug 1285888)
* Cacti Monitoring plugins and SNMP via TCP (bug 1268552)

Shortly about the new features.

Amazon RDS support in Nagios and Cacti.
amazon-web-services We have created the Nagios plugin and Cacti template to give you a chance to add Amazon RDS instances into your monitoring system. The plugins are getting various RDS metrics from Amazon CloudWatch. With Nagios you can have the following checks per instance: RDS Status, RDS Load Average, RDS Free Storage, RDS Free Memory. Also check out the examples of Cacti RDS graphs.

Nagios config template. We never have a good template of Nagios config in the documentation with examples on how to put together the plugins. So we have updated Configuration Best Practices section with it.

Freshness check for checksumming. A new option of the plugin pmp-check-pt-table-checksum allows you to specify an interval in days over which to ensure pt-table-checksum was run. It is useful in cases when the cron job doing the checksumming suddenly stopped working.

New generic Nagios plugin for PT tables. pmp-check-mysql-ts-count looks at a table and counts the number of rows since the last interval, and alerts if this exceeds the threshold. This could be the table referenced by tools from Percona Toolkit such as pt-deadlock-logger, pt-kill, pt-fk-error-logger, or a custom table supplied.

MySQL max user connections check. The plugin pmp-check-mysql-processlist has got a new option to alert when @@max_user_connections is configured on MySQL and any user reaches this limit.

A new tarball is available from downloads area or RPM and DEB packages from our software repositories. The plugins are fully supported for customers with a Percona Support contract and free installation services are provided as part of some contracts. In addition as part of Percona’s Remote DBA installation and setup of these tools are included with our services. You can find links to the documentation, forums and more at the project homepage.

Percona Monitoring PluginsAbout Percona Monitoring Plugins
Percona Monitoring Plugins are high-quality components to add enterprise-grade MySQL monitoring and graphing capabilities to your existing in-house, on-premises monitoring solutions. The components are designed to integrate seamlessly with widely deployed solutions such as Nagios, Cacti and Zabbix and are delivered in the form of templates, plugins, and scripts which make it easy to monitor MySQL performance.

The post Percona Monitoring Plugins 1.1.2, now with Amazon RDS support appeared first on MySQL Performance Blog.

Tools and tips for analysis of MySQL’s Slow Query Log

MySQL's Slow Query LogMySQL has a nice feature, slow query log, which allows you to log all queries that exceed a predefined about of time to execute. Peter Zaitsev first wrote about this back in 2006 – there have been a few other posts here on the MySQL Performance Blog since then (check this and this, too) but I wanted to revisit his original subject in today’s post.

Query optimization is essential for good database server performance and usually DBAs need to ensure the top performance possible for all queries. In MySQL, the desirable way is to generate a query log for all running queries within a specific time period and then run a query analysis tool to identify the bad queries. Percona Toolkit’s pt-query-digest is one of the most powerful tools for SQL analysis. That’s because pt-query-digest can generate a very comprehensive report that spots problematic queries very efficiently. It works equally well with Oracle MySQL server. This post will focus mainly on pt-query-digest.

Slow query log is great at spotting really slow queries that are good candidates for optimization. Beginning with MySQL 5.1.21, the minimum value is 0 for long_query_time, and the value can be specified to a resolution of microseconds. In Percona Server additional statistics may be output to the slow query log. You can find the full details here. For our clients, we often need to identify queries that impact an application the most. It does not always have to be the slowest queries – queries that runs more frequently with lower execution time per call put more load on a server than queries running with lower frequency. We of course want to get rid of really slow queries but to really optimize application throughput, we also need to investigate queries that generate most of the load. Further, if you enable option log_queries_not_using_indexes  then MySQL will log queries doing full table scans which doesn’t always reflect that the query is slow, because in some situations the query optimizer chooses full table scan rather than using any available index or probably showing all records from a small table.

Our usual recommendation is to generate the slow log with long_query_time=0. This will record all the traffic but this will be I/O intensive and will eat up disk space very quickly depending on your workload. So beware of running with long_query_time=0 for only a specific period of time and revert it back to logging only very slow queries. In Percona Server there is nice option where you can limit the rate of logging, log_slow_rate_limit is the option to handle it. Filtering slow query log is very helpful too in some cases e.g. if we know the main performance issue is table scans we can log queries only doing full table scans or if we see I/O is bottleneck we can collect queries doing full scans and queries creating on disk temporary tables. Again, this is only possible in Percona Server with the log_slow_filter option. Also, you may want to collect everything on slow query log and then filter with pt-query-digest. Depending on I/O capacity, you might prefer one or another way, as collecting everything in slow query log allows us to investigate other queries too if needed. Finally, use pt-query-digest to generate an aggregate report over slow query log which highlights the problematic part very efficiently. Again, pt-query-digest can bring up server load high so our usual recommendation on it is to move slow query log to some staging/dev server and run pt-query-digest over there to generate the report.

Note: changing the long_query_time parameter value only affects newly created connections to log queries exceeds long_query_time threshold. In Percona Server there is feature which changes variable scope to global instead of local. Enabling slow_query_log_use_global_control  log queries for connected sessions too after changing long_query_time parameter threshold. You can read more about this patch here.

I am not going to show you a detailed report of pt-query-digest and explain each part of it here, because it is well defined already by my colleague Ovais Tariq in this post. However, I will show you some of the other aspects of pt-query-digest tool here.

Let me show you code snippets that enable slow query log for only a specific time period with long_query_time=0 and log_slow_verbosity to ‘full’. log_slow_verbosity is a Percona Server variable which logs extra stats such as information on query cache, Filesort, temporary tables, InnoDB statistics etc. Once you are done collecting logs, revert back the values for long_query_time to the previous value, and finally run pt-query-digest on the log to generate report. Note: run the below code in same MySQL session.

-- Save previous settings
mysql> SELECT @@global.log_slow_verbosity INTO @__log_slow_verbosity;
mysql> SELECT @@global.long_query_time INTO @__long_query_time;
mysql> SELECT @@global.slow_query_log INTO @__slow_query_log;
mysql> SELECT @@global.log_slow_slave_statements INTO @__log_slow_slave_statements;
-- Keep this in safe place, we'll need to run pt-query-digest
mysql> SELECT NOW() AS "Time Since";
-- Set values to enable query collection
mysql> SET GLOBAL slow_query_log_use_global_control='log_slow_verbosity,long_query_time';
mysql> SET GLOBAL log_slow_verbosity='full';
mysql> SET GLOBAL slow_query_log=1;
mysql> SET GLOBAL long_query_time=0;
mysql> SET GLOBAL log_slow_slave_statements=1;
-- Verify settings are OK
mysql> SELECT @@global.long_query_time, @@global.slow_query_log, @@global.log_slow_verbosity;
-- wait for 30 - 60 minutes
-- Keep this one too, also for pt-query-digest
mysql> SELECT NOW() AS "Time Until";
-- Revert to previous values
mysql> SET GLOBAL slow_query_log=@__slow_query_log;
mysql> SET GLOBAL long_query_time=@__long_query_time;
mysql> SET GLOBAL log_slow_verbosity=@__log_slow_verbosity; -- if percona server
mysql> SET GLOBAL log_slow_slave_statements=@__log_slow_slave_statements;
-- Verify settings are back to previous values
mysql> SELECT @@global.long_query_time, @@global.slow_query_log, @@global.log_slow_verbosity, @@global.slow_query_log_file;
-- Then with pt-query-digest run like (replace values for time-since, time-until and log name)
$ pt-query-digest --since='<time-since>' --until='<time-until>' --limit=100% /path/to/slow_query_log_file.log > /path/to/report.out
-- If you're not using Percona Server then you need to remove all references to log_slow_verbosity, slow_query_log_use_global_control and log_slow_slave_statements (priot MySQL 5.6).

My colleague Bill Karwin wrote bash script that does almost the same as the above code. You can find the script to collect slow logs here. This script doesn’t hold connection to the database session while you wait for logs to accumulate and it sets all the variables back to the state they were before. For full documentation view this.

Further, you can also get explain output into the report from the pt-query-digest tool. For that you need to use –explain parameter similar to as follows.

$ pt-query-digest --explain u=<user>,p=<password>,h=<hostname> /path/to/slow.log > /path/to/report.out

Explain output in query report will get you all the information for query execution plan and explain output signal towards how that particular query going to be executed. Note that, if you execute pt-query-digest over slow query log other than originated server of slow query log as I mentioned above e.g. staging/dev you may get different execution path for the query in the report or lower number of rows to examined, etc., because usually staging/dev servers has different data distribution, different MySQL versions, or different indexes. MySQL explain adds overhead as queries needs to be prepared on the server to generate intended query execution path. For this reason, you may want to run pt-query-digest with –explain on a production replica.

It’s worth mentioning that logging queries with log_slow_verbosity in Percona Server is really handy as it shows lots of additional statistics and it is more helpful in situations when the explain plan reports a different execution path than when the query is executed. On that particular topic, you may want to check this nice post.

pt-query-digest also supports filters. You can read more about it here. Let me show you an example. The following command will discard everything apart from insert/update/delete queries in pt-query-digest output report.

$ pt-query-digest --filter '$event->{arg} =~ m/^(insert|update|delete)/i' --since='<time-since>' --until='<time-until>' --limit=100% /path/to/slow_query_log_file.log > /path/to/report.out

If you’re looking for some GUI tools for pt-query-digest then I would recommend reading this nice blogpost from my colleague Roman. Further, our CEO Peter Zaitsev also wrote a post recently where he shows the comparison between performance_schema and slow query log. Check here for details.

In related new, Percona recently announced Percona Cloud Tools, the next generation of tools for MySQL. It runs a client-side agent (pt-agent) which runs pt-query-digest on the server with some intervals and uploads the aggregated data to the Percona Cloud Tools API which process it further.  Query Analytics is one tool from the Percona Cloud Tools that provides advanced query metrics. It  is a nice visualization tool. You may be interested to learn more about it here, and it’s also worth viewing this related webinar about Percona Cloud Tools from our CTO Vadim Tkachenko.

Conclusion:
pt-query-digest from Percona Toolkit is a versatile (and free) tool for slow query log analysis. It provides good insight about every individual query, especially in Percona Server with log_slow_verbosity enabled, e.g. log queries with microsecond precision, log information about the query’s execution plan. On top of that, Percona Cloud Tools includes Query Analytics which provides you with good visuals about query performance and also provides a view of historical data.

The post Tools and tips for analysis of MySQL’s Slow Query Log appeared first on MySQL Performance Blog.

Percona Server 5.5.36-34.1 is now available

Percona Server version 5.5.36-34.1

Percona Server version 5.5.36-34.1

Percona is glad to announce the release of Percona Server 5.5.36-34.1 on March 17th, 2014 (Downloads are available here and from the Percona Software Repositories). Based on MySQL 5.5.36, including all the bug fixes in it, Percona Server 5.5.36-34.1 is now the current stable release in the 5.5 series. All of Percona‘s software is open-source and free, all the details of the release can be found in the 5.5.36-34.1 milestone at Launchpad.

Bugs Fixed:

  • After installing the auth_socket plugin any local user might get root access to the server. If you’re using this plugin upgrade is advised. This is a regression, introduced in Percona Server 5.5.31-30.3. Bug fixed #1289599.
  • The new client and server packages included files with paths that were conflicting with the ones in mysql-libs package on CentOS. Bug fixed #1278516.
  • A clean installation of Percona-Server-server-55 on CentOS would fail due to a typo in mysql_install_db call. Bug fixed #1291247.
  • Percona-Server-shared-55 package was still declared as providing mysql-libs, but it is not actually providing it anymore. Bug fixed #1291249.
  • Slave I/O thread wouldn’t attempt to automatically reconnect to the master after a network time-out (error: 1159). Bug fixed #1268729 (upstream #71374).
  • Slave I/O thread wouldn’t attempt to automatically reconnect to the master if setting master_heartbeat_period failed with a transient network error. Bug fixed #1268735 (upstream #71375).

Renaming the libmysqlclient to libperconaserverclient

This release fixes some of the issues caused by the libmysqlclient rename to libperconaserverclient in Percona Server 5.5.36-34.0. The old name was conflicting with the upstream libmysqlclient.

Except for packaging, libmysqlclient and libperconaserverclient of the same version do not have any differences. Users who previously compiled software against Percona-provided libmysqlclient will either need to install the corresponding package of their distribution, such as distribution or Oracle-provided package for CentOS and libmysqlclient18 for Ubuntu/Debian or recompile against libperconaserverclient. Another workaround option is to create a symlink from libperconaserverclient.so.18.0.0 to libmysqlclient.so.18.0.0.

Release notes for Percona Server 5.5.36-34.1 are available in our online documentation. Bugs can be reported on the launchpad bug tracker.

The post Percona Server 5.5.36-34.1 is now available appeared first on MySQL Performance Blog.

Percona Server 5.6.16-64.1 is now available

Percona Server version 5.6.16-64.1

Percona Server version 5.6.16-64.1

Percona is glad to announce the release of Percona Server 5.6.16-64.1 on March 17th, 2014 (Downloads are available here and from the Percona Software Repositories.

Based on MySQL 5.6.16, including all the bug fixes in it, Percona Server 5.6.16-64.1 is the current GA release in the Percona Server 5.6 series. All of Percona’s software is open-source and free, all the details of the release can be found in the 5.6.16-64.1 milestone at Launchpad.

Bugs Fixed:

  • After installing the auth_socket plugin any local user might get root access to the server. If you’re using this plugin upgrade is advised. This is a regression, introduced in Percona Server 5.6.11-60.3. Bug fixed #1289599
  • The new client and server packages included files with paths that were conflicting with the ones in mysql-libs package on CentOS. Bug fixed #1278516.
  • A clean installation of Percona-Server-server-55 on CentOS would fail due to a typo in mysql_install_db call. Bug fixed #1291247.
  • libperconaserverclient18.1 Debian/Ubuntu packages depended on multiarch-support, which is not available on all the supported distribution versions. Bug fixed #1291628.
  • The InnoDB file system mutex was being locked incorrectly if Atomic write support for Fusion-io devices was enabled. Bug fixed #1287098.
  • Slave I/O thread wouldn’t attempt to automatically reconnect to the master after a network time-out (error: 1159). Bug fixed #1268729 (upstream #71374).

Renaming the libmysqlclient to libperconaserverclient

This release fixes some of the issues caused by the libmysqlclient rename to libperconaserverclient in Percona Server 5.6.16-64.0. The old name was conflicting with the upstream libmysqlclient.

Except for packaging, libmysqlclient and libperconaserverclient of the same version do not have any differences. Users who previously compiled software against Percona-provided libmysqlclient will either need to install the corresponding package of their distribution, such as distribution or Oracle-provided package for CentOS and libmysqlclient18 for Ubuntu/Debian or recompile against libperconaserverclient. Another workaround option is to create a symlink from libperconaserverclient.so.18.0.0 to libmysqlclient.so.18.0.0.

Release notes for Percona Server 5.6.16-64.1 are available in our online documentation. Bugs can be reported on the launchpad bug tracker.

The post Percona Server 5.6.16-64.1 is now available appeared first on MySQL Performance Blog.

Percona Server with TokuDB: Packing 15TB into local SSDs

Two weeks ago we released an Alpha release of Percona Server with TokuDB. Right now I am on a final stage of evaluation of TokuDB for using in our project Percona Cloud Tools and it looks promising.

What is the most attractive in TokuDB? For me it is compression, but not just compression: TokuDB provides great performance over compressed data.

In my synthetic tests I saw a compression ratio of 10:1 (TokuDB LZMA to InnoDB uncompressed), in the real production data it is less, 6:1, but still impressive.

In our servers we have 4 x SSD Crucial M500 960GB combined in RAID5, which give 2877.0 GB of usable space. With TokuDB we should be able to pack around 15TB of raw data. Of course we can try InnoDB compression, but the best we can get is 2x compression without sacrificing performance.

And of course TokuDB is transaction, fully ACID-compliant with automatic crash-recovery storage engine.

This all makes TokuDB a very attractive choice for handling terabytes of data (or as it popular to say nowadays “BigData”).

One of first operational questions we have is how to handle backups.
For backups we use LVM partitions and the mylvmbackup tool. Unfortunately Percona XtraBackup is not able to handle TokuDB tables (and probably won’t be able anytime soon). The other choice is to use TokuDB Hot back-up, available by Tokutek Enterprise Subscription. I did not test it myself, so I can’t provide any feedback.

And of course there are things which I do not fully like in TokuDB:

  • No Foreign Keys support. It is not a big issue for us, but I know for some users this is a showstopper.
  • Time-based checkpoints. You may not notice a direct effect from this, but we clearly see it in our benchmarks. Every 60 sec (default timeperiod between checkpoints) we see a drop in throughput during write-intensive benchmarks. It is very similar to drops in InnoDB we tried to solve (and are still trying), for example see Adaptive flushing in MySQL 5.6. My advice to the Tokutek team would be to also look into a fuzzy check-pointing, instead of time-based.
  • All TokuDB files are stored in a single directory, sometime with mangled filenames. This especially becomes bad in sharding or multi-tenant environments when tens of thousands of files are in the same directory

Well, I guess for now, we will take these limitations as TokuDB specific and will deal with them.

Next week we plan on a Beta release of Percona Server with TokuDB, so stay tuned!

The post Percona Server with TokuDB: Packing 15TB into local SSDs appeared first on MySQL Performance Blog.

Hardening your Cacti setup

If you are using Percona Monitoring Plugins for Cacti, this article should be important to you.

By default, the Cacti setup is closed from accessing from Web. Here is an excerpt from /etc/httpd/conf.d/cacti.conf:

# httpd 2.4
		Require host localhost
		# httpd 2.2
		Order deny,allow
		Deny from all
		Allow from localhost

In order, to access the Cacti web interface, most likely, you will be changing this configuration. Commenting out Deny/Require statements will open the Cacti to the local network or Internet. This will create a potential vulnerability to disclose MySQL password contained in scripts under the directory /usr/share/cacti/scripts/, in particular /usr/share/cacti/scripts/ss_get_mysql_stats.php and /usr/share/cacti/scripts/ss_get_mysql_stats.php.cnf, when trying to access them from Web.

Unfortunately, the folder /usr/share/cacti/scripts/ is not closed by default as it is done with /usr/share/cacti/log/ and /usr/share/cacti/rra/ directories.

We strongly recommend to close any access from the web for these additional directories or files:

* /usr/share/cacti/scripts/
* /usr/share/cacti/site/scripts/ (for Debian systems)
* /usr/share/cacti/cli/
* /usr/share/cacti/.boto

Here is an example of httpd configuration that can harden your setup (goes to /etc/httpd/conf.d/cacti.conf):

Redirect 404 /
                        Require all denied
                        Order deny,allow
                        Deny from all

Even if you fully password-protected your Cacti installation using HTTP authentication, it is still recommended to double-secure the directories and files listed above.

Thanks to William Lightning for reporting this issue.

The post Hardening your Cacti setup appeared first on MySQL Performance Blog.

Great Speakers, Fun, and Insights at Percona Live MySQL Conference

The Percona Live MySQL Conference 2014 is less than two weeks away, running April 1-4, and excitement is building for the great lineup of speakers, events, and networking opportunities it offers. This year’s conference also features the first-ever Open Source Appreciation Day, which takes place on March 31, 2014, and includes two separate events, CentOS Dojo Santa Clara and OpenStack Today, highlighting these two key technologies. A new keynote address about the OpenStack ecosystem by Boris Renski, a member of the OpenStack Board of Directors, has also been added.
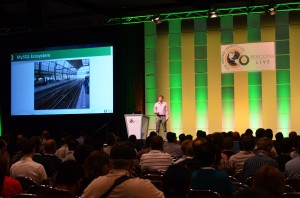
Percona Live MySQL Conference Keynotes

Positive Energy at the Percona Live MySQL Conference

The energy at the Percona Live MySQL Conferences is palpable as everyone from experts to novices gather to learn, share, and enjoy. In an interview, Jeremy Cole, Google senior systems engineer and a presenter at the conference, said, “Aside from actual sessions, one of the things I look forward to most each year is the social aspects. This conference is the only place where nearly every member of the MySQL community comes together all at once. I am excited about Oracle’s participation and their sessions about MySQL 5.7, and the many talks from those who have deployed MySQL 5.6 in production.”

Similarly, Mats Kindahl, senior principal software developer in MySQL at Oracle and a conference presenter, is enthusiastic about the opportunity that Percona Live MySQL Conference and Expo 2014 presents: “I’m quite interested in anything related to high-availability and scalability — especially real-life experience from people managing large farms. There is a lot of value in seeing and understanding what kind of problems people run into in practice. Because it’s never what you see in a theoretical presentation on high-availability. It’s always the details that make a difference.”

Keynote Panel

I look forward to keynotes this year from Oracle’s Tomas Ulin, Fusion-io’s Nisha Talagala, Dropbox’s Renjish Abraham, Big Fish Games’ Sean Chighizola, Continuent’s Robert Hodges, and Percona’s Peter Zaitsev. This year we will also feature a keynote panel on “The Future of Operating MySQL at Scale”. I will host the panel which features Robert Hodges, Nisha Talagala, and Peter Zaitsev, and will focus on the challenges of operating MySQL at scale when downtime is very costly for mission-critical applications and more and more companies running MySQL in the Cloud. We will discuss topics such as high availability clusters, multi-datacenter replication, and data storage in addition to other important future challenges.

Friday Keynote on OpenStack

A new keynote has been added on Friday, April 4, 2014 about OpenStack. Boris Renski, OpenStack Board Member and CMO of Mirantis, will present “OpenStack Co-Opetition, A View from Within”. He will discuss the competitive and cooperative nature of the OpenStack ecosystem and touch upon topics such as TROVE which is relevant to Database-as-a-Service in relation to OpenStack.

Open Source Appreciation Day Details

On Monday, March 31, 2014, the day before the official start of the conference, we will host the first-ever Open Source Appreciation Day at the Percona Live MySQL Conference, which consists of two events:

CentOS Dojo Santa Clara – This free event, offered in cooperation with CentOS, brings together the CentOS community to discuss systems administration, best practices and emerging technologies. Due to space constraints, attendance is limited to 75 people and advanced registration is required. The event will take place from 10:00 a.m. to 6:00 p.m. in Room 203 of the Santa Clara Convention Center.
OpenStack Today – This free event is offered in cooperation with members of the OpenStack community and will provide an opportunity to hear from leading industry technologists who will speak about today’s fastest growing open source cloud infrastructure project, OpenStack, and how MySQL fits into the evolving OpenStack roadmap. Due to space constraints, attendance is limited to 100 people and advanced registration is required. The event will take place from 1:00 p.m. to 6:00 p.m. in Room 204 of the Santa Clara Convention Center.

Attendees who register for one of the two Open Source Appreciation Day events can use the discount code “OPEN” to receive a 15 percent discount on their Percona Live MySQL Conference and Expo 2014 registration. Registration for either of these events includes a free Expo Hall and Keynote Pass for the Percona Live MySQL Conference and Expo.

Lightning Talks and Birds of a Feather Sessions (BOFs)

Both the Lightning Talks and BOFs are a perennial crowd favorite at Percona Live conferences.

The always entertaining Lightning Talks are an opportunity for attendees to propose, explain, exhort, or rant on any MySQL-related topic for five minutes. Topics might include a new idea, successful project, cautionary story, quick tip, or demonstration. Lightning Talks will take place Thursday night, April 3, 2014, during the MySQL Community Networking Reception, which begins immediately following the breakout sessions.

Birds of a Feather sessions enable attendees with interests in the same project or topic to enjoy some quality face time. This year’s topics include MySQL 5.6 in production, best practices for MySQL data replication, extreme MySQL performance, and much more. We’ve even added a BOF on OpenStack this year. The BOFs will take place Wednesday night, April 2, from 6:00 p.m. to 7:00 p.m. BOFs are open to all members of the MySQL community, whether you attend the conference or not.

Community Dinner and Community Reception

The Percona Live MySQL Conference and Expo is a great place for networking, providing attendees with the opportunity to make connections that can help enhance their career, facilitate a current project, or inspire new ideas. This year we have a Welcome Reception on Tuesday night and the Community Networking Reception on Thursday night. Pythian is organizing the community dinner this year on Wednesday night, following the BOFs. For a complete list of events and times, see the Conference Program.

Sponsors

This year’s Percona Live MySQL Conference and Expo includes an extensive list of prominent sponsors. Recent additions to the list include Gold Sponsor Machine Zone, Silver Sponsor Tesora (formerly ParElastic), and lounge and recharging station sponsor Facebook. Sponsorship opportunities are still available. Sponsors of the Percona Live MySQL Conference and Expo 2014 become part of a dynamic and growing ecosystem and interact with more than 1,000 DBAs, sysadmins, developers, CTOs, CEOs, business managers, technology evangelists, solutions vendors, and entrepreneurs in the heart of Silicon Valley. The complete list of sponsors includes:

• Diamond Plus: Continuent, Fusion-io
• Platinum: Booking.com
• Gold: Machine Zone, Micron, Pythian, SkySQL
• Silver: AppDynamics, Box, InfiniDB, Diablo, Galera/Codership, Google, Rackspace, Tesora, Twitter, Yelp
• Exhibitors: Attunity, Blackbird (formerly PalominoDB), Dropbox, Etsy, FoundationDB, HGST, RSSBus, ScaleArc, ScaleBase, Severalnines, Sphinx, Tokutek, VividCortex
• Other: Devart, Facebook, Webyog, MailChimp
• Media: ADMIN Magazine, Datanami, DBTA, Linux Journal, Linux Pro Magazine, O’Reilly, Software Developer’s Journal
• Open Source Appreciation Day: Tesora, hastexo, CentOS

Visit the Percona Live MySQL Conference and Expo 2014 website for more information and to register. I hope to see you in Santa Clara in two weeks!

The post Great Speakers, Fun, and Insights at Percona Live MySQL Conference appeared first on MySQL Performance Blog.

How to log slow queries on Slave in MySQL 5.0 with pt-query-digest

Working as a Percona Support Engineer, every day we are seeing lots of issues related to MySQL replication. One very common issue is slave lagging. There are many reasons for slave lag but one common reason is that queries are taking more time on slave then master. How to check and log those long-running queries?  From MySQL 5.1, log-slow-slave-statements variable was introduced, which you can enable on slave and log slow queries. But what if you want to log slow queries on slave in earlier versions like MySQL 5.0?  There is a good solution/workaround: pt-query-digest. How? let’s take a look….

If you want to log all queries that are running on slave (including those, running by sql thread), you can use pt-query-digest with –processlist and –print (In pt-query-digest 2.1.9) OR –output (In pt-query-digest 2.2.7) options and log all queries in specific file. I have tested it in my local environment and it works.

You can start pt-query-digest like below on Slave,

nil@Dell:~$ /percona-toolkit-2.1.9/bin/pt-query-digest --processlist u=msandbox,p=msandbox,S=/tmp/mysql_sandbox34498.sock --print --no-report
OR
nil@Dell:-$ /percona-toolkit-2.2.7/bin/pt-query-digest --processlist u=msandbox,p=msandbox,S=/tmp/mysql_sandbox34498.sock --no-report --output=slowlog

Run some long running queries on Master,

nil@Dell:~$ mysql -umsandbox -p --socket=/tmp/mysql_sandbox34497.sock
Enter password:
mysql> use percona
Reading table information for completion of table and column names
You can turn off this feature to get a quicker startup with -A
Database changed
mysql> delete from test limit 5000000;
Query OK, 5000000 rows affected (1 min 54.33 sec)
mysql> delete from test limit 5000000;
Query OK, 5000000 rows affected (1 min 56.42 sec)

mysql>

and you’ll see the output on Slave like this,

nil@Dell:~/Downloads/percona-toolkit-2.1.9/bin$ ./pt-query-digest --processlist u=msandbox,p=msandbox,S=/tmp/mysql_sandbox34498.sock --print --no-report
# Time: 2014-03-18T12:10:57
# User@Host: system user[system user] @ []
# Query_time: 114.000000 Lock_time: 0.000000 Rows_sent: 0 Rows_examined: 0
use percona;
delete from test limit 5000000;
nil@Dell:~/Downloads/percona-toolkit-2.2.7/bin$ pt-query-digest --processlist u=msandbox,p=msandbox,S=/tmp/mysql_sandbox34498.sock --no-report --output=slowlog
# Time: 2014-03-18T12:21:05
# User@Host: system user[system user] @ []
# Query_time: 117.000000 Lock_time: 0.000000 Rows_sent: 0 Rows_examined: 0
use percona;
delete from test limit 5000000;

You can also run pt-query-digest in background like a daemon and send output to the specific file like slow.log and review it.

i.e /percona-toolkit-2.1.9/bin/pt-query-digest –processlist u=msandbox,p=msandbox,S=/tmp/mysql_sandbox34498.sock –print –no-report > slow.log 2>&1

OR

i.e /percona-toolkit-2.2.7/bin/pt-query-digest –processlist u=msandbox,p=msandbox,S=/tmp/mysql_sandbox34498.sock –no-report –output=slowlog > slow.log 2>&1

Here, the default output will be just like slow query log. If we have master-master replication where every master is slave too and we want to log only those statements that are executing by sql_thread then –filter option can be used like this:

pt-query-digest –filter ‘$event->user eq “system user”‘ –no-report –output=slowlog

Since pt-query-digest–processlist polls 10 times/second ( –interval option), it’s not reliable to use for collecting complete query logs, because quick queries could fall in between the polling intervals. And in any case, it won’t measure query time with precision any better than 1/10th of a second. But if the goal is to identify queries that are very long-running, it should be adequate.

The post How to log slow queries on Slave in MySQL 5.0 with pt-query-digest appeared first on MySQL Performance Blog.

Percona XtraDB Cluster 5.6.15-25.5 is now available

Percona XtraDB Cluster 5.6.15-25.5
Percona is glad to announce the new release of Percona XtraDB Cluster 5.6 on March 20th 2014. Binaries are available from downloads area or from our software repositories.

Based on Percona Server 5.6.15-63.0 including all the bug fixes in it, Galera Replicator 3.4 and on Codership wsrep API 25.5 is now the current General Availability release in 5.6 series. All of Percona‘s software is open-source and free, all the details of the release can be found in the 5.6.15-25.5 milestone on Launchpad.

New Features

  • wsrep patch did not allow server to start with Query Cache enabled. This restriction and check have been removed now and query cache can be fully enabled from config file.
  • New SST options have been implemented: inno-backup-opts, inno-apply-opts, inno-move-opts which pass options to backup, apply and move stages of innobackupex.
  • The joiner would wait and not fall back to choosing other potential donor nodes (not listed in wsrep_sst_donor) by their state. This happened even when comma was added at the end. This fixes it for that particular case. Bug fixed #1285380.
  • Initial configurable timeout, of 100 seconds, to receive a first packet via SST has been implemented, so that if donor dies somewhere in between, joiner doesn’t hang. Timeout can be configured with the sst-initial-timeout variable.

Bugs fixed

  • Replication of partition tables without binlogging enabled failed, partition truncation didn’t work because of lack of TO isolation there. Bug fixed #1219605.
  • Using LOAD DATA INFILE in with autocommit set to 0 and wsrep_load_data_splitting set to ON could lead to incomplete loading of records while chunking. Bug fixed #1281810.
  • Garbd could crash on CentOS if variable gmcast.listen_addr wasn’t set. Bug fixed #1283100.
  • Node couldn’t be started with wsrep_provider_options option debug set to 1. Bug fixed #1285208.
  • Boostrapping a node in a NON-PRIMARY state would lead to crash. Bug fixed #1286450.
  • New versions of xtrabackup SST scripts were ignoring --socket parameter passed by mysqld. Bug fixed #1289483.
  • Regression in Galera required explicitly setting socket.ssl to Yes even if you set up variables socket.ssl_key and socket.ssl_cert. Bug fixed #1290006.
  • Fixed the clang build issues that were happening during the Galera build. Bug fixed #1290462.
  • Better diagnostic error message has been implemented when wsrep_max_ws_size limit has been succeeded. Bug fixed #1280557.
  • Fixed incorrect warnings and implemented better handling of repeated usage with same value for wsrep_desync. Bug fixed #1281696.
  • Fixed the issue with wsrep_slave_threads wherein if the number of slave threads was changed before closing threads from an earlier change, it could increase the total number of threads beyond value specified in wsrep_slave_threads. Bug fixed #1290612
  • A regression in mutex handling caused dynamic update of wsrep_log_conflicts to hang the server. Bug fixed #1293624.
  • Presence of /tmp/test directory and an empty test database caused Percona XtraBackup to fail, causing SST to fail. This has been fixed in Percona XtraDB Cluster’s xtrabackup SST script, by using unique temporary directories with Percona XtraBackup. Bug fixed #1294760.
  • After installing the auth_socket plugin any local user might get root access to the server. If you’re using this plugin upgrade is advised. This is a regression, introduced in Percona XtraDB Cluster 5.6.14-25.1. Bug fixed #1289599

Other bug fixes: #1289776, #1279343, #1259649, #1292533, #1272982, #1287098, #1284670, and #1264809.

Release notes for Percona XtraDB Cluster 5.6.15-25.5 are available in our online documentation along with the installation and upgrade instructions. We did our best to eliminate bugs and problems during the testing release, but this is a software, so bugs are expected. If you encounter them, please report them to our bug tracking system.

Percona XtraDB Cluster Errata can be found in our documentation.

The post Percona XtraDB Cluster 5.6.15-25.5 is now available appeared first on MySQL Performance Blog.

Percona Monitoring Plugins 1.1.3. Addressed CVE-2014-2569.

Percona is glad to announce the release of Percona Monitoring Plugins 1.1.3.

Changelog:

* Introduced more secure location of PHP script configs to harden a Cacti setup
* Addressed CVE-2014-2569

We have introduced a more secure location /etc/cacti/ for PHP script configs. Earlier, the only way was to keep .php.cnf configs inside of scripts/ folder which falls under the web directory of Cacti setup, thus provides a potential security vulnerability. We strongly recommend to move all .php.cnf files from /usr/share/cacti/scripts/ to /etc/cacti/ and also harden your Cacti setup.

A new tarball is available from downloads area or RPM and DEB packages from our software repositories. The plugins are fully supported for customers with a Percona Support contract and free installation services are provided as part of some contracts. In addition as part of Percona’s Remote DBA installation and setup of these tools are included with our services. You can find links to the documentation, forums and more at the project homepage.

Percona Monitoring PluginsAbout Percona Monitoring Plugins
Percona Monitoring Plugins are high-quality components to add enterprise-grade MySQL monitoring and graphing capabilities to your existing in-house, on-premises monitoring solutions. The components are designed to integrate seamlessly with widely deployed solutions such as Nagios, Cacti and Zabbix and are delivered in the form of templates, plugins, and scripts which make it easy to monitor MySQL performance.

The post Percona Monitoring Plugins 1.1.3. Addressed CVE-2014-2569. appeared first on MySQL Performance Blog.